Oct 17, 2017
TechnologyI downloaded some template from grafana.net, but none of them work properly,
following are the trouble-shooting of template.
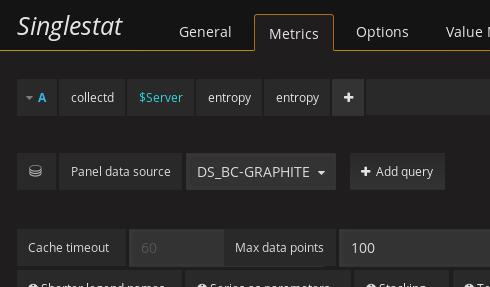
- Change the data source.
View the json file, get its input field:
{
  "__inputs": [
    {
      "name": "DS_BC-GRAPHITE",
      "label": "BC-Graphite",
      "description": "",
      "type": "datasource",
      "pluginId": "graphite",
      "pluginName": "Graphite"
    }
  ],
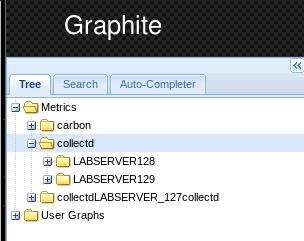
This means you have to define a datasource named DS_BC-GRAPHITE, like
following:

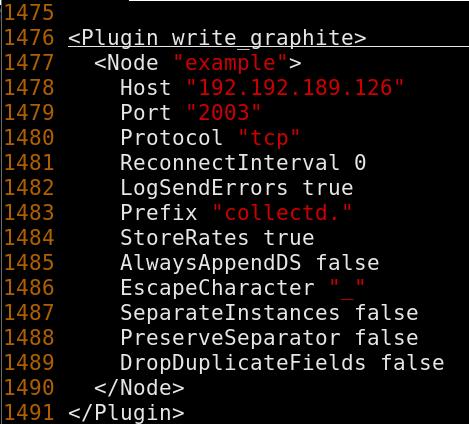
- Change collectd’s write_graphite structure.

The item could not be displayed properly, because the definition for data
listed as:

so you should have following definition in /etc/collectd.conf:

Notice collectd., this means you could use collectd.* for getting the
data.
Oct 17, 2017
TechnologyAIM
For managing the servers via ipmitools.
Installation
Install ipmitools via yum install -y ipmitool, then you could use ipmitool
for managing the servers.
HuaWei Examples
Official Website:
http://support.huawei.com/enterprise/docinforeader!loadDocument1.action?contentId=DOC1000055104&partNo=10082
Username/passwd:

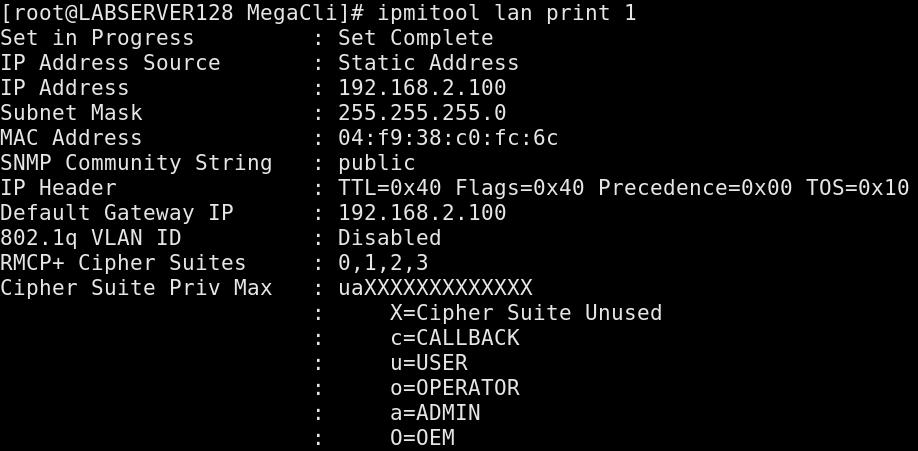
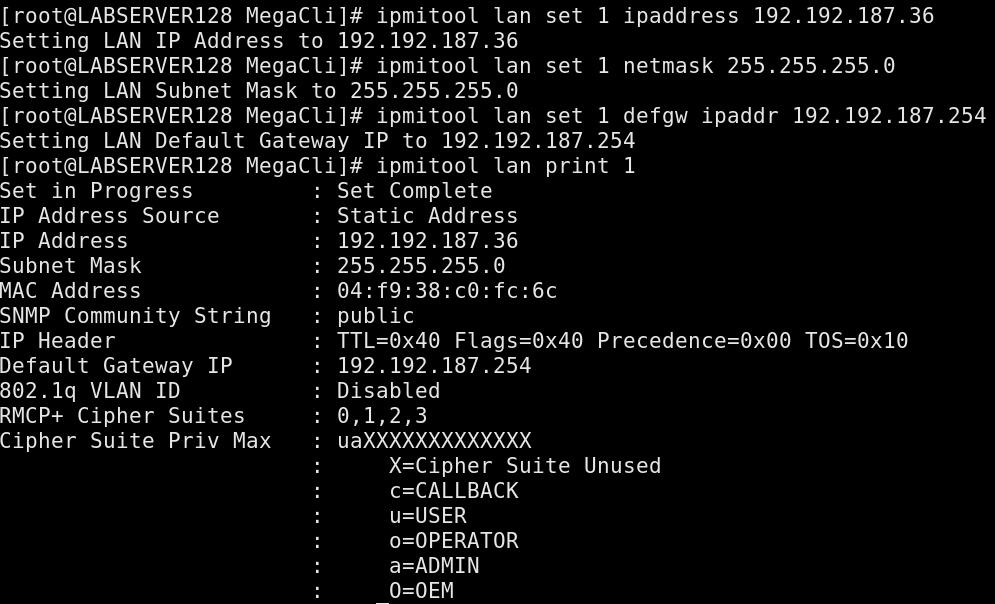
Using ipmitool for displaying the lan info:

Setting IP
Setting IP Address/Netmask/gateway via following way:

iBMC
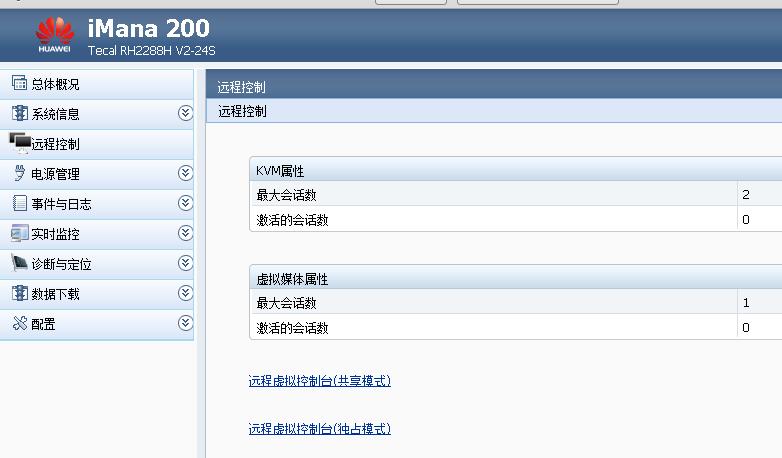
Huwei using iBMC, so now you could visit its ip address for managing this
server:


Now you could using its management URL:

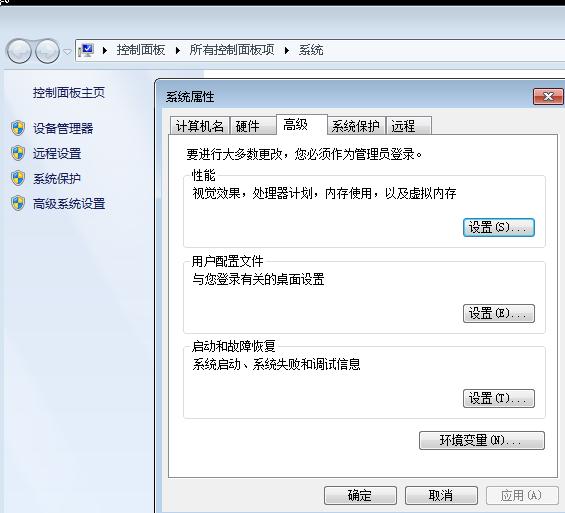
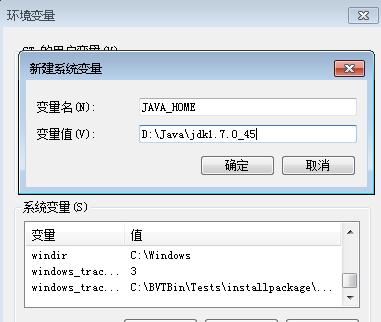
Add new Env Var:

New JAVA_HOME:

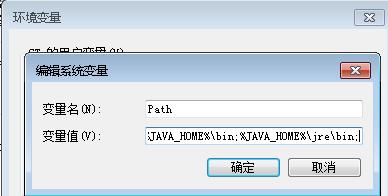
Path:

Verification:

IE Configuration
Use IE-64-bit:

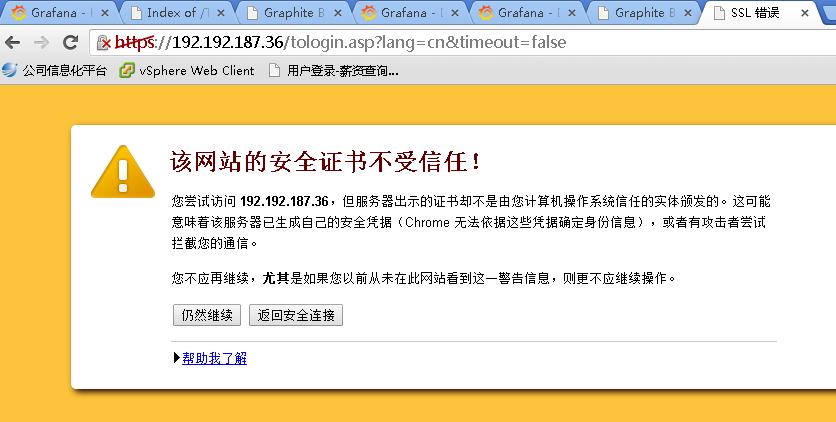
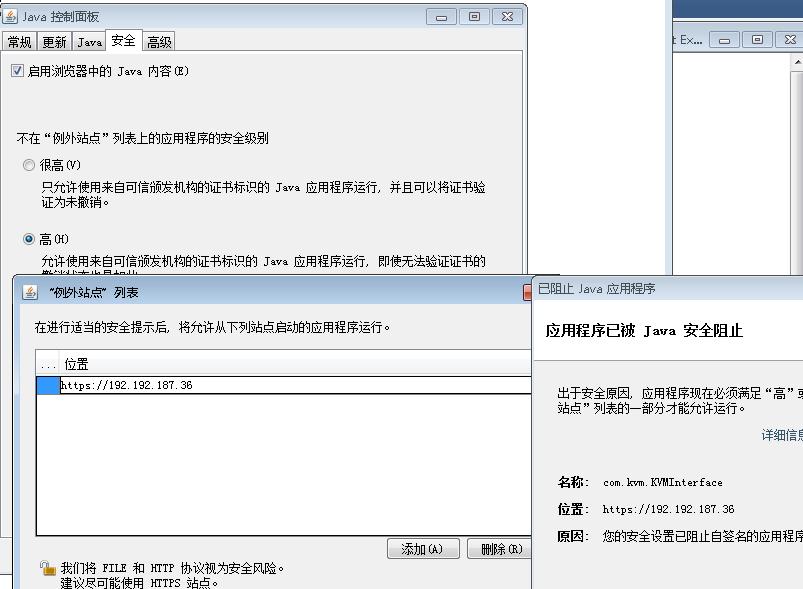
Add Exception:

Refresh again and accept exception:

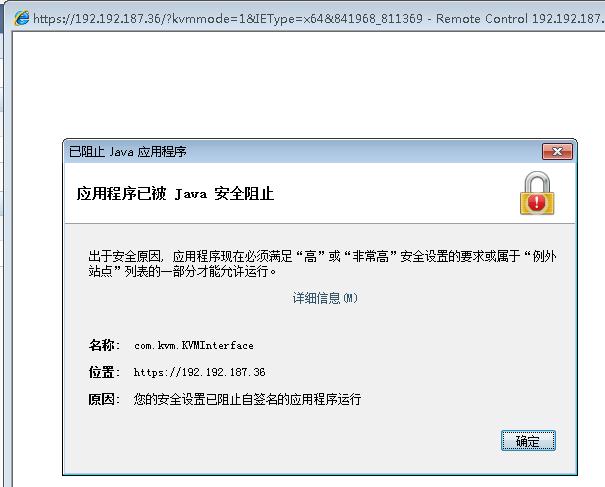
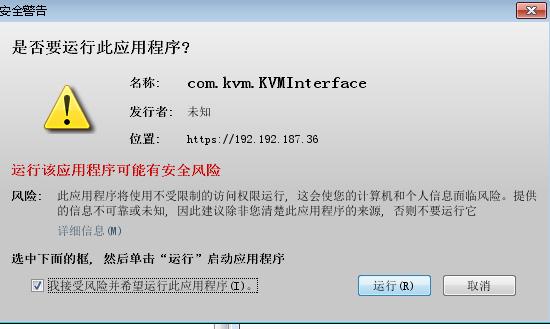
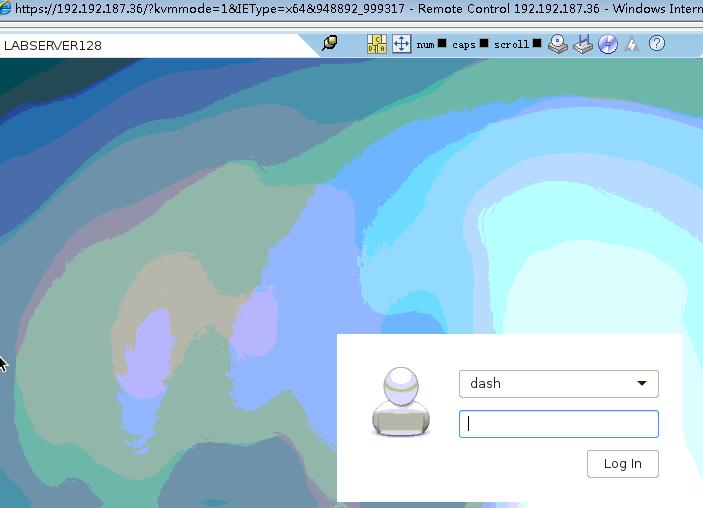
You got this shit window finally:

Auto-load modules
For automatically load modules, do following:
# vim /etc/modules-load.d/ipmi.conf
ipmi_msghandler
ipmi_devintf
ipmi_si

Oct 11, 2017
TechnologyInstallation and Configuration
Via collectd you could monitoring the disk statistics, the configuration files
is listed as following:
# cat /etc/collectd.conf
.....
LoadPlugin disk
No other configuration on disk configuration, then you could see all of the
items which listed under /proc/diskstats would be send to graphite database.
Another plugin
Located at:
https://github.com/indygreg/collectd-diskstats
Configuration:
[root@LABSERVER127 collectd]# pwd
/usr/lib64/collectd
[root@LABSERVER127 collectd]# ls diskstats.py
diskstats.py

# vim /etc/collectd.conf
.....
LoadPlugin python
....
<Plugin python>
    ModulePath "/usr/lib64/collectd"
    Import "diskstats"

    <Module diskstats>
        Disk sda
        Disk sda1
        Disk sdb
    </Module>
</Plugin>
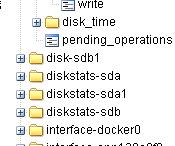
After restarting the collectd service, you could see the python uploaded
statistic data has been displayed in graphite gui.

Disk Statistic Data
Refers to:
https://collectd.org/wiki/index.php/Plugin:Disk
user_00@xxxxxx64:~> cat /proc/diskstats
   1    0 ram0 0 0 0 0 0 0 0 0 0 0 0
   1    1 ram1 0 0 0 0 0 0 0 0 0 0 0
   1    2 ram2 0 0 0 0 0 0 0 0 0 0 0
   1    3 ram3 0 0 0 0 0 0 0 0 0 0 0
   1    4 ram4 0 0 0 0 0 0 0 0 0 0 0
   1    5 ram5 0 0 0 0 0 0 0 0 0 0 0
   1    6 ram6 0 0 0 0 0 0 0 0 0 0 0
   1    7 ram7 0 0 0 0 0 0 0 0 0 0 0
   1    8 ram8 0 0 0 0 0 0 0 0 0 0 0
   1    9 ram9 0 0 0 0 0 0 0 0 0 0 0
   1   10 ram10 0 0 0 0 0 0 0 0 0 0 0
   1   11 ram11 0 0 0 0 0 0 0 0 0 0 0
   1   12 ram12 0 0 0 0 0 0 0 0 0 0 0
   1   13 ram13 0 0 0 0 0 0 0 0 0 0 0
   1   14 ram14 0 0 0 0 0 0 0 0 0 0 0
   1   15 ram15 0 0 0 0 0 0 0 0 0 0 0
   7    0 loop0 0 0 0 0 0 0 0 0 0 0 0
   7    1 loop1 0 0 0 0 0 0 0 0 0 0 0
   7    2 loop2 0 0 0 0 0 0 0 0 0 0 0
   7    3 loop3 0 0 0 0 0 0 0 0 0 0 0
   7    4 loop4 0 0 0 0 0 0 0 0 0 0 0
   7    5 loop5 0 0 0 0 0 0 0 0 0 0 0
   7    6 loop6 0 0 0 0 0 0 0 0 0 0 0
   7    7 loop7 0 0 0 0 0 0 0 0 0 0 0
   8    0 sda 30526 2009 1087215 193416 115412736 102258023 1811485376 87116184 0 18093240 87295592
   8    1 sda1 22754 483028 5686677 45493256
   8    2 sda2 166 662 8265 66120
   8    3 sda3 6528 570989 123499806 987893792
   8    4 sda4 2887 30896 88516083 708124240
   9    0 md0 0 0 0 0 0 0 0 0 0 0 0

这个命令用于显示磁盘、分区和统计信息:sda为整个硬盘的统计信息,sda1为第一个分区的统计信息,sda2为第二个分区的统计信息。
ramdisk设备为通过软件将RAM当做硬盘来使用的一项技术。

user_00@xxxxxx64:~> cat  /sys/block/sda/stat
30537     2009  1087303   193476 115421945 102267776 1811640504 87122648        0 18094108 87302116

/proc/diskstats文件比/sys/block/sda/stat文件多3个域,从左至右分别对应主设备号,次设备号和设备名称。后续的11个域在这两个文件里是相同的,它们的函义将在下面解释。除了第9个域,所有的域都是从启动时的累积值。

第1个域:读完成次数 ----- 读磁盘的次数,成功完成读的总次数。
(number of issued reads. This is the total number of reads completed successfully.)

第2个域:合并读完成次数, 第6个域:合并写完成次数。为了效率可能会合并相邻的读和写。从而两次4K的读在它最终被处理到磁盘上之前可能会变成一次8K的读,才被计数(和排队),因此只有一次I/O操作。这个域使你知道这样的操作有多频繁。
(number of reads merged)

第3个域:读扇区的次数,成功读过的扇区总次数。
(number of sectors read. This is the total number of sectors read successfully.)

第4个域:读花费的毫秒数,这是所有读操作所花费的毫秒数(用__make_request()到end_that_request_last()测量)。
(number of milliseconds spent reading. This is the total number of milliseconds spent by all reads (as measured from __make_request() to end_that_request_last()).)

第5个域:写完成次数 ----写完成的次数,成功写完成的总次数。
(number of writes completed. This is the total number of writes completed successfully.)

第6个域:合并写完成次数 -----合并写次数。
(number of writes merged Reads and writes which are adjacent to each other may be merged for efficiency. Thus two 4K reads may become one 8K read before it is ultimately handed to the disk, and so it will be counted (and queued) as only one I/O. This field lets you know how often this was done.)

第7个域:写扇区次数 ---- 写扇区的次数,成功写扇区总次数。
(number of sectors written. This is the total number of sectors written successfully.)

第8个域:写操作花费的毫秒数  ---  写花费的毫秒数,这是所有写操作所花费的毫秒数(用__make_request()到end_that_request_last()测量)。
(number of milliseconds spent writing This is the total number of milliseconds spent by all writes (as measured from __make_request() to end_that_request_last()).)

第9个域:正在处理的输入/输出请求数 -- -I/O的当前进度,只有这个域应该是0。当请求被交给适当的request_queue_t时增加和请求完成时减小。
(number of I/Os currently in progress. The only field that should go to zero. Incremented as requests are given to appropriate request_queue_t and decremented as they finish.)

第10个域:输入/输出操作花费的毫秒数  ----花在I/O操作上的毫秒数,这个域会增长只要field 9不为0。
(number of milliseconds spent doing I/Os. This field is increased so long as field 9 is nonzero.)

第11个域:输入/输出操作花费的加权毫秒数 -----  加权, 花在I/O操作上的毫秒数,在每次I/O开始,I/O结束,I/O合并时这个域都会增加。这可以给I/O完成时间和存储那些可以累积的提供一个便利的测量标准。
(number of milliseconds spent doing I/Os. This field is incremented at each I/O start, I/O completion, I/O merge, or read of these stats by the number of I/Os in progress (field 9) times the number of milliseconds spent doing I/O since the last update of this field. This can provide an easy measure of both I/O completion time and the backlog that may be accumulating.)
Collectd Disk 解释
含义:
merged” are the number of operations, that could be merged into other, already queued operations, i. e. one physical disk access served two or more logical operations. Of course, the higher that number, the better.
合并读/写完成次数。为了效率可能会合并相邻的读/写。从而两次4K的读写在被处理到磁盘前会被合并。
octects: Disk Traffic的时间:

disk-ops: 一次磁盘操作时间a
disk-time: Disk time per operation. 一次IO操作完成所需要的平均时间。
与Field9/10/11对应理解
Field  9 -- # of I/Os currently in progress
    The only field that should go to zero. Incremented as requests are
    given to appropriate struct request_queue and decremented as they finish.

Field 10 -- # of milliseconds spent doing I/Os
    This field increases so long as field 9 is nonzero.

Field 11 -- weighted # of milliseconds spent doing I/Os
    This field is incremented at each I/O start, I/O completion, I/O
    merge, or read of these stats by the number of I/Os in progress
    (field 9) times the number of milliseconds spent doing I/O since the
    last update of this field.  This can provide an easy measure of both
    I/O completion time and the backlog that may be accumulating.

第9个域:正在处理的输入/输出请求数 -- -I/O的当前进度,只有这个域应该是0。当请求被交给适当的request_queue_t时增加和请求完成时减小。

第10个域:输入/输出操作花费的毫秒数  ----花在I/O操作上的毫秒数,这个域会增长只要field 9不为0。

第11个域:输入/输出操作花费的加权毫秒数 -----  加权, 花在I/O操作上的毫秒数,在每次I/O开始,I/O结束,I/O合并时这个域都会增加。这可以给I/O完成时间和存储那些可以累积的提供一个便利的测量标准。
disk-io-time: time spent doing I/O
disk-pending_operations: pending I/O requests.
weighted_io_time: i/o完成时间和backlog.
Sep 20, 2017
Technology1. 搬迁前操作
注意:此步骤在服务器搬迁前(周三下午三点前)执行。
此步骤执行完后将更改云终端虚拟机IP,由之前的192.168.13段更改为宝地广场使用的192.168.103段。
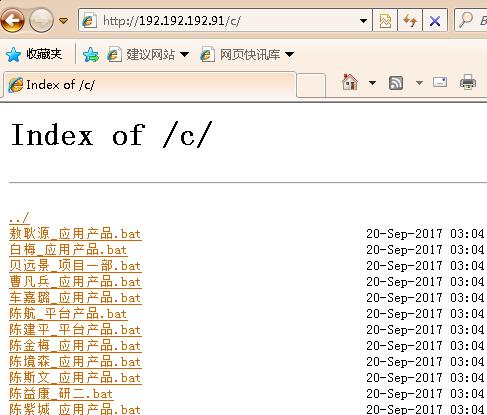
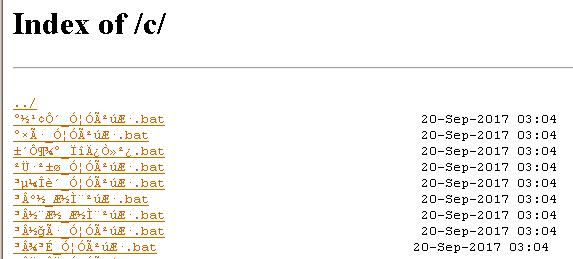
浏览器访问http://192.192.192.91/c/

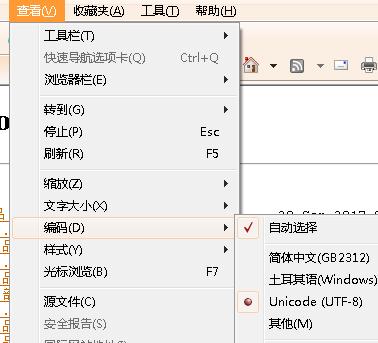
如果碰到网页乱码, 则更改浏览器默认编码为UTF-8即可:


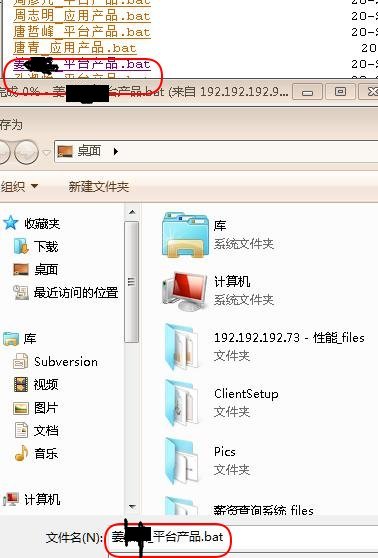
在网页中查找自己名字对应的bat文件,右键另存到本地。

用记事本打开该bat文件,用纸笔记下更改后的IP地址。
服务器搬迁到宝地广场后,需要用IP地址配置云终端盒子:

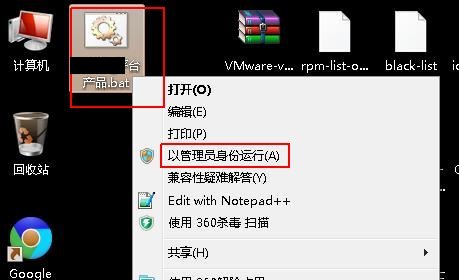
点击鼠标右键,选择以管理员身份运行,
按下鼠标右键以后,该bat文件将自动更改你的云终端虚拟机IP地址/子网掩码/网关地址:

2. 搬迁后配置
宝地服务器就绪后(秘书会通知大家的),在个人的云终端盒子上配置。
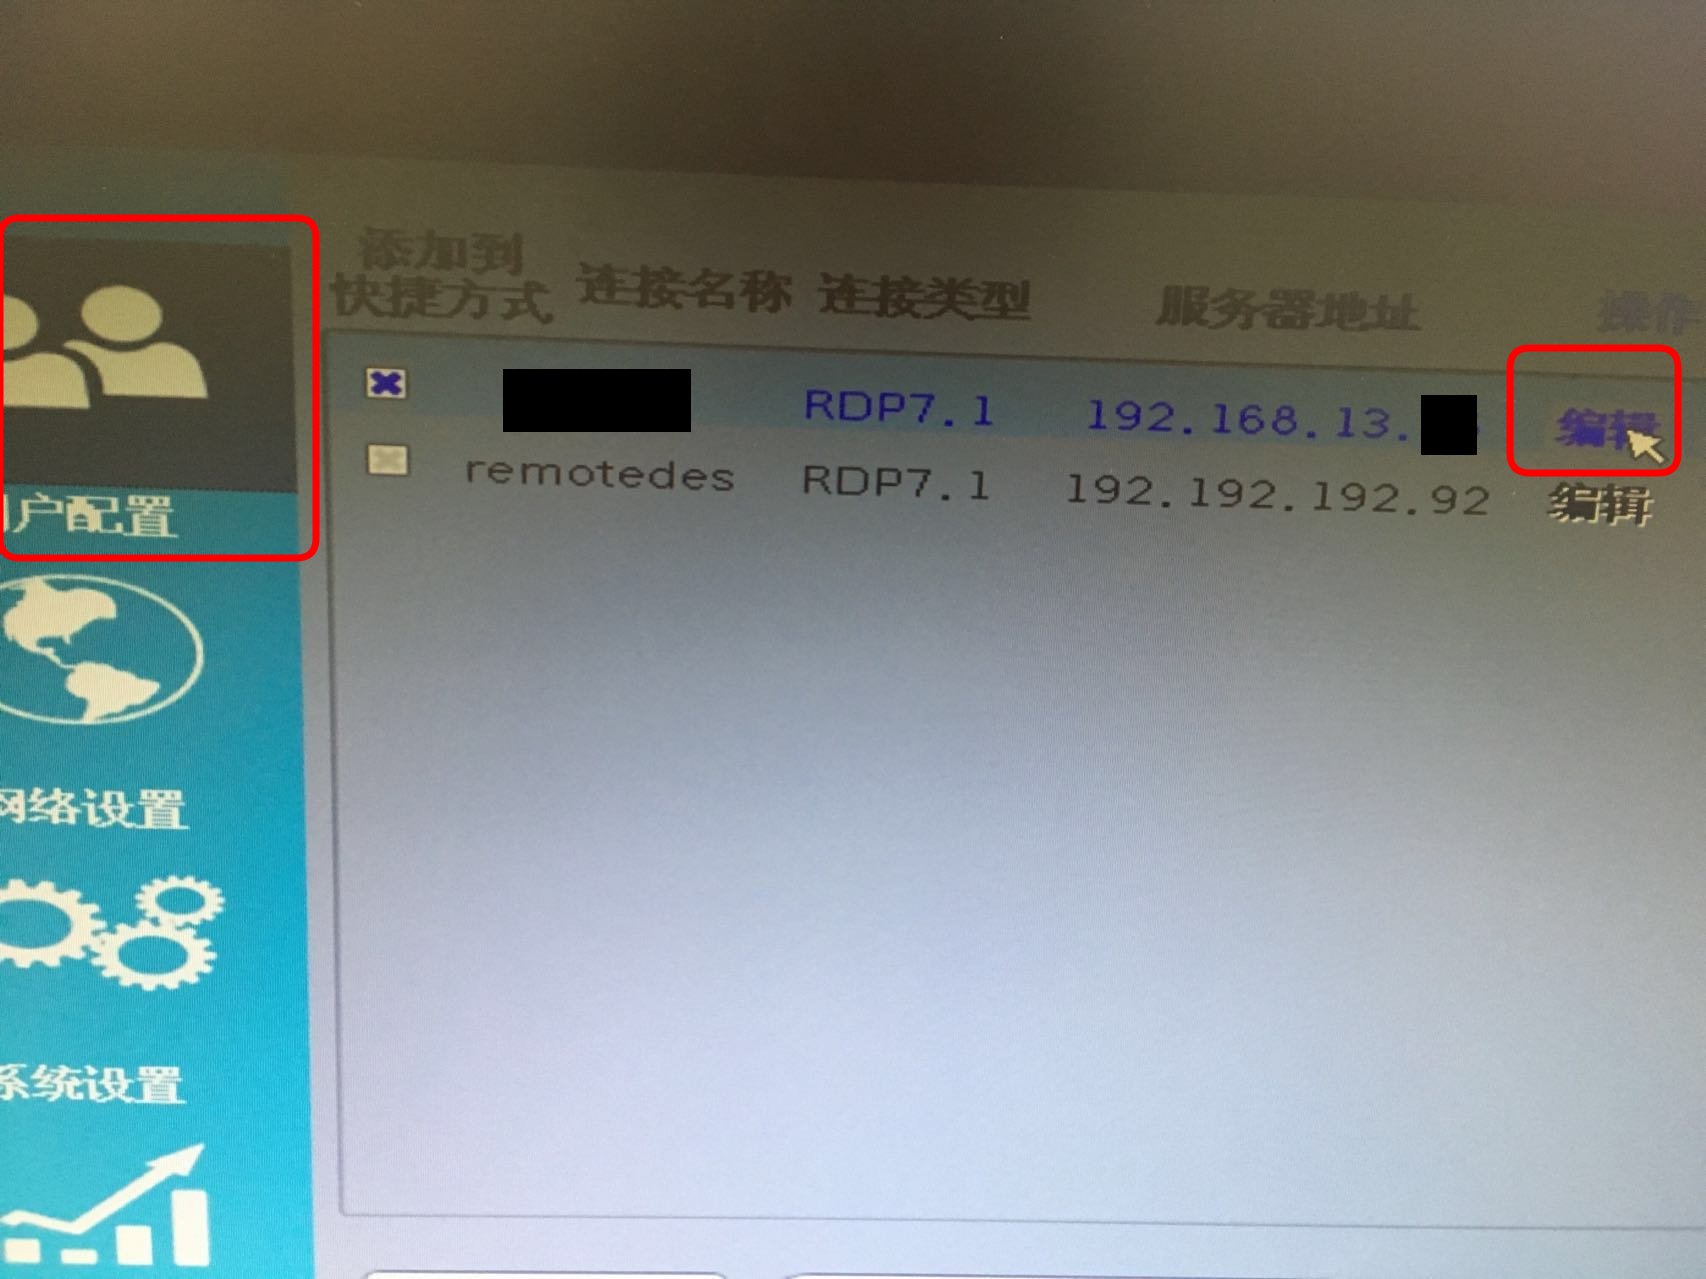
点击配置按钮进入到配置界面:

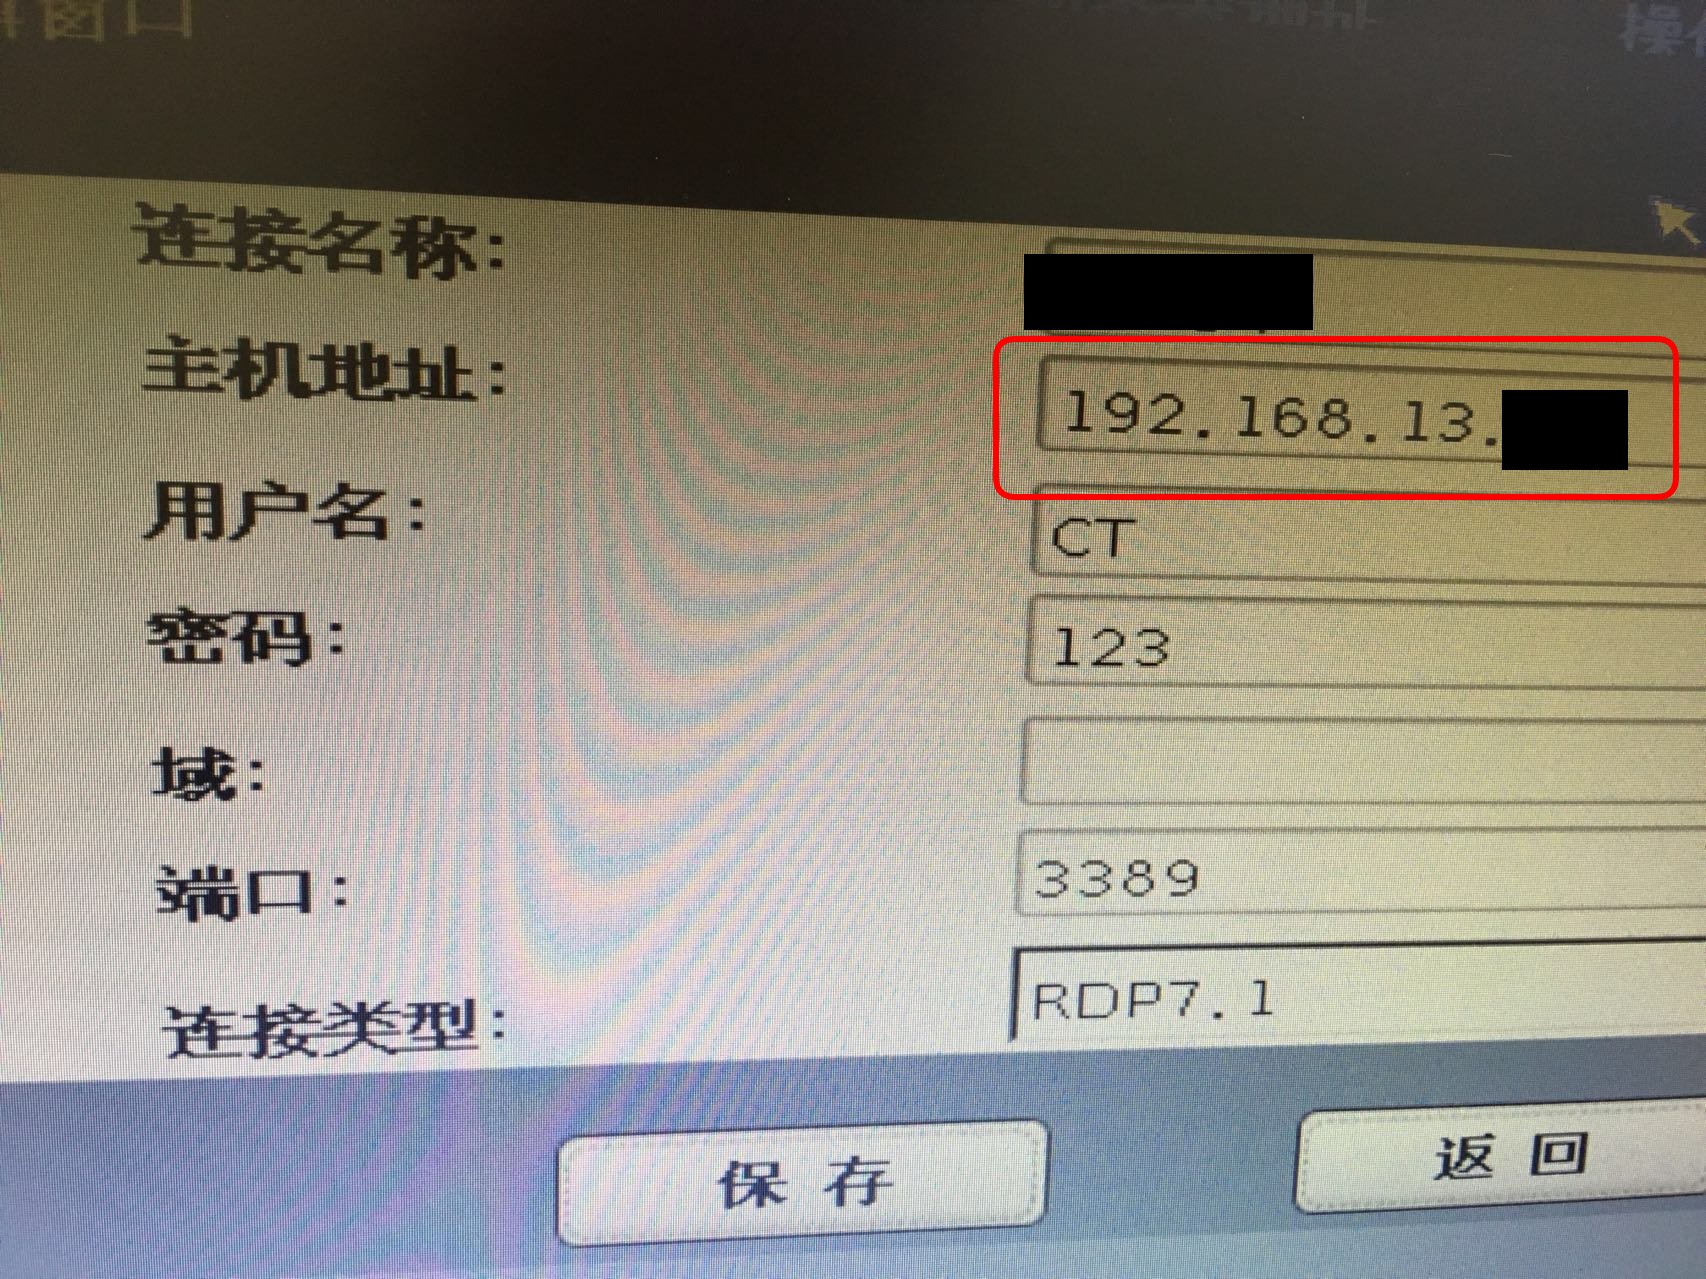
点击用户配置后再点击编辑:

用第一步记下的IP地址替换原配置的主机地址, 之后点击保存返回:

点击原有的个人配置文件,应该可以进入到原来的桌面了。
Sep 18, 2017
TechnologyWhen install docker on Debian9, when configured the static ip address mode,
then you install docker, you will find the ip address won’t be configured as
you imagined. It will get the dhcp ip from your dhcpd server. Following are
the steps for correct this bug:
# systemctl disable docker.service
# systemctl enable rc-local.service
Then in /etc/rc.local file you will add following lines:
#!/bin/sh -e
systemctl start docker.service
Then you should chmod a+x /etc/rc.local.
Now restart machine, you will find your networking address is configured as
you defined in /etc/network/interfaces, and your docker start correctly.

