Oct 25, 2013
Technology###Install Xapian-core
Xapian-core is the Xapian library itself. We have to install it from source-code
	$ wget http://oligarchy.co.uk/xapian/1.2.15/xapian-core-1.2.15.tar.gz
	$ tar xzvf xapian-core-1.2.15.tar.gz && cd xapian-core-1.2.15/
	$ ./configure --prefix=/usr/local && make && make install
###Install Omega
Omega utilities is an application built on Xapianm, consisting of indexers and a CGI search frontend.
	$ wget http://oligarchy.co.uk/xapian/1.3.1/xapian-omega-1.3.1.tar.gz
	$ tar xzvf xapian-omega-1.3.1.tar.gz &&  cd xapian-omega-1.3.1/
	$ ./configure --prefix=/usr/local && make && make install
###Configure the CGI for apache
Change the “ScriptAlias /cgi-bin/ “/usr/lib/cgi-bin/"", so the httpd knows cgi binaries is put in the /usr/lib/cgi-bin directory. Then we have to copy the omega library to the /usr/lib/cgi-bin/:
	$ cd xapian-omega-1.3.1/
	$ cp omega /usr/lib/cgi-bin/omega.cgi
	$ cp omega.conf /usr/lib/cgi-bin/
	$ chmod 755 /usr/lib/cgi-bin/omega.cgi
The Configuration file /usr/lib/cgi-bin/omega.conf should looks like this:
	database_dir /var/lib/omega/data
	template_dir /var/lib/omega/templates
	log_dir /var/log/omega
	cdb_dir /var/lib/omega/cdb
Copy the templates to the new directory:
	$ cd xapian-omega-1.3.1/
	$ cp -ar /templates/* /var/lib/omega/templates/
	$ mkdir -p /var/lib/omega/data/default
	$ chmod -R 644 /var/lib/omega/data/default
Generate the database file:
$ sudo /usr/local/bin/omindex --db /var/lib/omega/data/default --url / /home/Trusty/code/octo/debian_octopress/public/
###Result
Restart the httpd daemon:
$ systemctl restart httpd
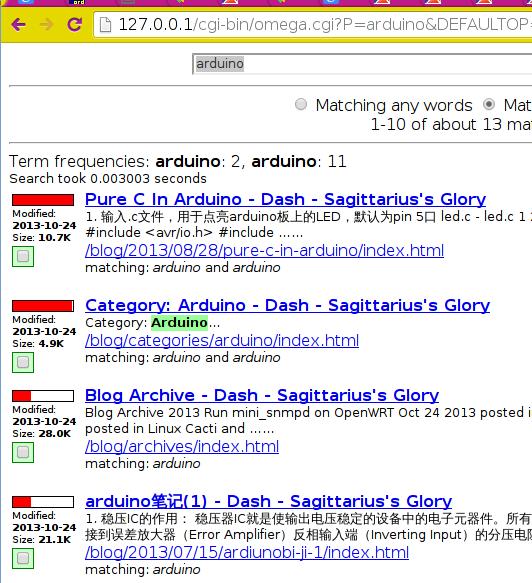
Browser http://localhost/cgi-bin/omega.cgi you will see the following picture:
Oct 25, 2013
Technology###Install packages
Install the following packages
	$ sudo pacman -S wicd
	$ sudo pacman -S wicd-gtk
	$ sudo pacman -S notification-daemon
	$ sudo pacman -S python2-notify
###Configure
Add your account to users group
# gpasswd -a USERNAME users
Start Wicd as System Service:
$ systemctl start wicd.service
Automatically start service at boot-up:
$ systemctl enable wicd.service
Add the wicd-client as tray in the rc.lua file
$ wicd-client --tray
Oct 24, 2013
Technology###OpenWRT Configuration
Install mini_snmpd:
	$ opkg update
	$ opkg install mini-snmpd
Configure mini_snmpd: mainly changes: option enabled 1, then change the option contact and location. But infact we can only fetch list interfaces in cacti:
	root@OpenWrt:~# cat /etc/config/mini_snmpd
	config mini_snmpd
		option enabled 1
		option ipv6 0
		option community 'public'
		option contact 'gwoguowug@gmail.com'
		option location 'Asia/China/Nanjing'

		# enable basic disk usage statistics on specified mountpoint
		list disks '/jffs'
		list disks '/tmp'

		# enable basic network statistics on specified interface
		# 4 interfaces maximum, as named in /etc/config/network
		list interfaces 'loopback'
		list interfaces 'lan'
		list interfaces 'wan'
Restart the mini_snmpd:
$ /etc/init.d/mini_snmpd restart
###Cacti Configuration
Add a new device named OpenWRT, the configuration may like following:
	Change the Host Template to Generic SNMP-enabled Host
	Downed Device Detection - Ping
	Ping Method - ICMP Ping
Then you can add your own data sources, graph templates, new graph, new graph Trees, then display them. the picture may looks like as following:

Oct 23, 2013
Technology###Prepare the script
We get the current system load from /proc/loadavg:
	[Trusty@XXXyyy ~]$ cat /bin/online.sh
	#!/bin/sh
	echo .1.3.6.1.4.1.102.8
	cat /proc/loadavg | awk {'print $1'}
Then we have to add this script to our /etc/snmp/snmpd.conf:
extend .1.3.6.1.4.1.2021.53 online_monitor /bin/sh /bin/online.sh
Restart the service:
systemctl restart snmpd
Use snmpwalk to view the newly added item:
snmpwalk -v 2c -c public 10.0.0.221 .1.3.6.1.4.1.2021.53
###Fetch the data
See the following data is what we want:
	root@ubuntu:/etc# snmpwalk -v 2c -c public 10.0.0.221 .1.3.6.1.4.1.2021.53.4.1.2.14.111.110.108.105.110.101.95.109.111.110.105.116.111.114.2
	iso.3.6.1.4.1.2021.53.4.1.2.14.111.110.108.105.110.101.95.109.111.110.105.116.111.114.2 = STRING: "0.77"
###Draw images in cacti
First, add a data templates:
Console->Data Templates->Add,
Data Template Name: MonitorArchCustomized
Data Source Name: |host_description|-MonitorArchCustomized
Data Input Method: Get SNMP Data
Associated RRA’s: Hourly(1 Minutes Average)
Internal Data Source Name: MonitorArchCustom
Then click “Create”
some additional field will be displayed, in the newly field “Custom Data [data input: Get SNMP Data]” insert the OID field with “.1.3.6.1.4.1.2021.53.4.1.2.14.111.110.108.105.110.101.95.109.111.110.105.116.111.114.1”(which you got from the snmpwalk output result)
Second, add a graph templates:
Templat Name: MonitorArchCustomized
Graph template Title: |host_description|-MonitorArchCustomized
Create and then insert the Graph Template Items, add like following:
	Graph Item 	Data Source 	Graph Item Type 	CF Type 	Item Color
	Item # 1 	(MonitorArchCustom): 	AREA 	AVERAGE 	  	FF00FF 	Move Down Move Up 	Delete
	Item # 2 	(MonitorArchCustom): 	GPRINT 	LAST 	  	F5F800 	Move Down Move Up 	Delete
	Item # 3 	(MonitorArchCustom): Average 	GPRINT 	AVERAGE 	  	8D85F3 	Move Down Move Up 	Delete
	Item # 4 	(MonitorArchCustom): MAX 	GPRINT 	MAX 	  	005D57 	Move Down Move Up 	Delete
Also notice the Data Source should be MonitorArchCustom.
Third, add a new graph under Host of ArchLinux.
Select the Graph template and then click Create.
After some minutes, you will see the newly captured data and the images under graphs-> Arch-> Host:ArchLinux. Maybe Your graphs trees are not the same as mine, you got found your own location.

Oct 23, 2013
TechnologyOn the machine being monitored, check the snmpd configuration file, you will find some items like following:
	$ cat /etc/snmp/snmpd.conf
	rocommunity public
	rwcommunity admin
	agentaddress tcp:161
	If you want to enable Location and contact, add:
	syslocation Bat. C2
	syscontact someone@somewhere.org
On the monitor PC, we can use following command to view the monitored machine’s status:
	$ snmpwalk -c Trusty -v 2c 10.0.0.221:661
	or
	$ snmpwalk -c Trusty -v 2c 10.0.0.221
Add a new device for monitoring: Console-> Management->Devices, add new, the configuration should like following:

After save, you should view the result displayed like:
	ArchLinux (10.0.0.221)
	 SNMP Information
	System:Linux DashArch 3.11.6-1-ARCH #1 SMP PREEMPT Fri Oct 18 23:22:36 CEST
	 2013 x86_64
	Uptime: 1137 (0 days, 0 hours, 0 minutes)
	Hostname: DashArch
	Location: Unknown
	Contact: root@localhost
Draw disks
Add following line into snmpd.conf
includeAllDisks
But I failed, later will change.
###Add Graphs
Click “Create Graphs for this Host”, then you will asked to add the graphs.
After you add the graphs, add a new graph trees. Then add a Tree Items, Parent -> [root] Tree Item Type –> Host, Host –> ArchLinux(10.0.0.221), then save.
Now click on graphs, you can get your tree and view all of the images.
###Add Device for Winxp
Install the snmp service under control pannel.
enable the snmp service in Administration tools -> Service.
In cacti, add a new equipment, host templates choose “Windows 2000/XP host” , Downed Device Detection choose “SNMP uptime” , then add your own data source and graphics.