
Building Poll circuit on EagleBone
Nov 15, 2013Technology
###Background Knowledge 三极管(NPN型)的用法很简单(半圆形平的一面朝自己,引脚朝下),左边接电源中间为触发极,右边输出,有点像开关,只要中间的脚有微弱电流触发,就如同开关被打开,电流就会从左边流向右边。
###Background Knowledge 三极管(NPN型)的用法很简单(半圆形平的一面朝自己,引脚朝下),左边接电源中间为触发极,右边输出,有点像开关,只要中间的脚有微弱电流触发,就如同开关被打开,电流就会从左边流向右边。
###SourceCode Preparation 1. Get the latest code of beaglebone kernel:
git clone git://github.com/RobertCNelson/linux-dev.git
2. Check for your cross-compiler:
	$ which arm-linux-gnueabi-gcc
	/media/y/embedded/gcc-linaro-arm-linux-gnueabi-2012.02-20120222_linux/bin/arm-linux-gnueabi-gcc
3. Start a new branch
	$ git checkout origin/am33x-v3.2 -b am33x-v3.2
	Branch am33x-v3.2 set up to track remote branch am33x-v3.2 from origin.
	Switched to a new branch 'am33x-v3.2'
Since the latest kernel has been moved 3.12, we have to checkout am33x-v3.12
$ git checkout origin/am33x-v3.12 -b am33x-v3.12
You also have to manually download the latest kernel source code from github:
$ git clone git://git.kernel.org/pub/scm/linux/kernel/git/stable/linux-stable.git
###Configure everything before compilation Edit the system.sh file
$ cp system.sh.sample system.sh
The system.sh should have following lines:
	echo "Using: Cross Compiler"
	CC=arm-linux-gnueabi-
	##For TI: OMAP3/4/AM35xx
	ZRELADDR=0x80008000
	#LINUX_GIT=/home/user/linux-stable/
	LINUX_GIT=/media/x/bbBlack/linux/git/linux-stable/
Then run ./build_kernel.sh to see your kernel is under compiling, you will be prompted to asked “make menuconfig”, choose whatever you want.Wait patiently until all of your compilation is done.
###Install kernel
Edit the destination for your installation, edit the file “system.sh”:
	MMC=/dev/mmcblk0
	# or whatever you found in your own system.
Then you simply input ./tools/install_kernel.sh, you will be asked some questions, answer then and your kernel will be installed to your sd card. Now use the SD card for booting system, you will get a brand-new system. ###Install Filesystem Download the pre-configured filesystems from:
	# For example, download the quantal related image, that's 12.10.
	$ wget http://rcn-ee.net/deb/rootfs/quantal/ubuntu-12.10-console-armhf-2013-07-22.tar.xz
	$ unxz ubuntu-12.10-console-armhf-2013-07-22.tar.xz
	$ tar xvf ubuntu-12.10-console-armhf-2013-07-22.tar
Then insert your SD card, simply input:
	# take BeagleBoneBlack for example:
	$ sudo ./setup_sdcard.sh --mmc /dev/sdX --uboot bone
After setup SD card, using the newly configured SD card for booting up the system, you will get the new system running the pre-configured rootfs.
###Preparation of the IRremote library Using the downloaded,
	Trusty@SomethingMissing:~/code/arduino/arduino-1.0.5/libraries$ cp -r ../../library/Arduino_IRremote_master/ ./
	Trusty@SomethingMissing:~/code/arduino/arduino-1.0.5/libraries$ pwd
	/home/Trusty/code/arduino/arduino-1.0.5/libraries
Or using git the get the latest one, in fact this one is not new at all , it updates 2 years ago.
$ git clone git://github.com/shirriff/Arduino-IRremote.git
Now we can use it for programming. ###Programming insert the code and verify the result.
	#include <IRremote.h>  // 使用IRRemote函数库

	const int irReceiverPin = 2;  // 红外接收器的 OUTPUT 引脚接在 PIN2 接口 定义irReceiverPin变量为PIN2接口

	IRrecv irrecv(irReceiverPin); // 设置irReceiverPin定义的端口为红外信号接收端口
	decode_results results;    // 定义results变量为红外结果存放位置

	void setup()
	{
	  Serial.begin(9600);   // 开启串口,波特率为9600
	  irrecv.enableIRIn();   // 启动红外解码
	}

	void loop()
	{
	  if (irrecv.decode(&results)) {   // 解码成功,把数据放入results变量中
	    // 把数据输入到串口
	    Serial.print("irCode: ");
	    Serial.print(results.value, HEX); // 显示红外编码
	    Serial.print(",  bits: ");
	    Serial.println(results.bits); // 显示红外编码位数
	    irrecv.resume();    // 继续等待接收下一组信号
	  }
	  delay(600); //延时600毫秒,做一个简单的消抖
	}
###Verification See the wired image:
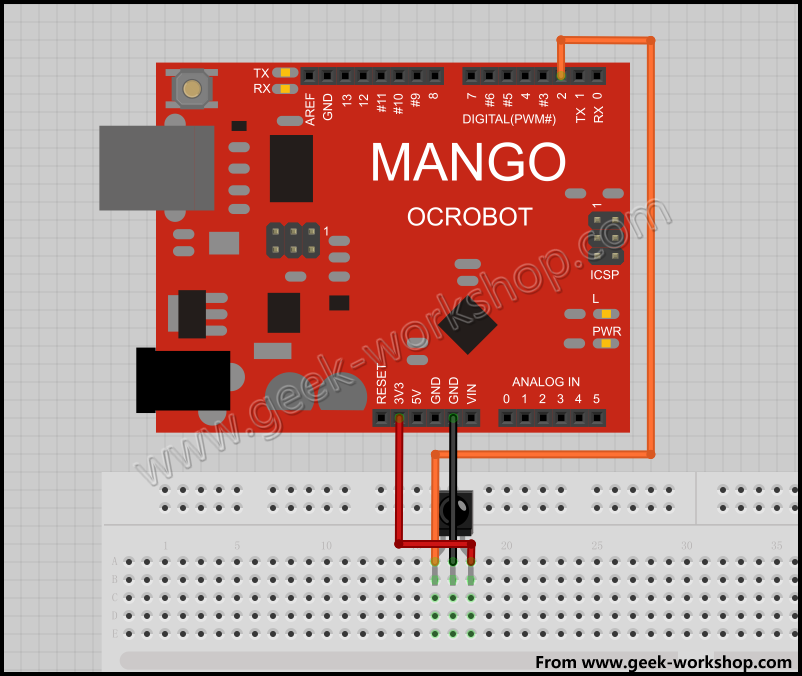
Then see how to connect the sensor:

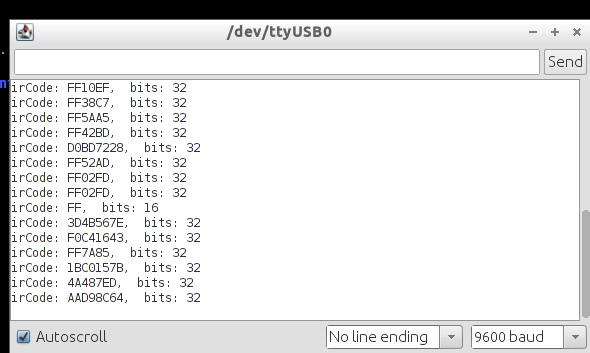
Now see the result:
###Seeing the light Now we can use IRremote for controlling our mp3 player. Because it only occupy 1 GPIO, and it could support so many combinations, we can use it to control the player’s activities.
###Local Development on Beaglebone board. On Beagle to verify local development:
	#include <iostream>
	using namespace std;


	int main()
	{
		cout<<"Hello Beagle World!"<<endl;
		return 0;
	}
Compile and run:
	$ g++ -o test test.cpp
	$ ./test
	Hello Beagle World!
###Using Cross-compiler for developing applications for Beaglebone Launch eclipse, then install new software via help-> Install new software, make sure installed CDT. then we will install RSE.
	$ pwd
	/home/Trusty/.eclipse/org.eclipse.platform_4.3.0_1543616141_linux_gtk_x86_64/plugins
	cp -ar /home/Trusty/Downloads/RSE/eclipse/features/* ./
	cd ../plugins/
	cp -ar /home/Trusty/Downloads/RSE/eclipse/plugins/* ./
This installed the RSE(Remote System Explorer). We can use it for browsing the remote beaglebone board.
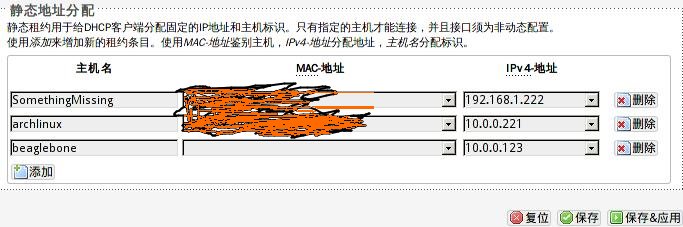
1. Configure the following rules under OpenWRT router:
config host
	option name 'beaglebone'
	option ip '10.0.0.123'
And in configuration webpage we can see the requiment is like following:
2. Now reboot beagle board, to see the client’s caught ip address:
	root@beaglebone:~# ifconfig
	eth0      Link encap:Ethernet  HWaddr xx:cx:gaoguogueogu
	          inet addr:10.0.0.123  Bcast:10.0.0.255  Mask:255.255.255.0
	          inet6 addr: fe80::9259:afff:fe65:d98c/64 Scope:Link
	          UP BROADCAST RUNNING MULTICAST  MTU:1500  Metric:1
Also in OpenWRT router we can see the attached pc:
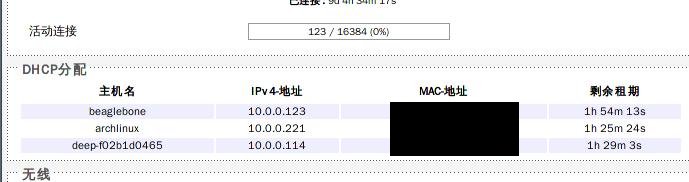
This indicate the client-id specified assignment could judged by dhcpd to assign the specified address