Dec 28, 2015
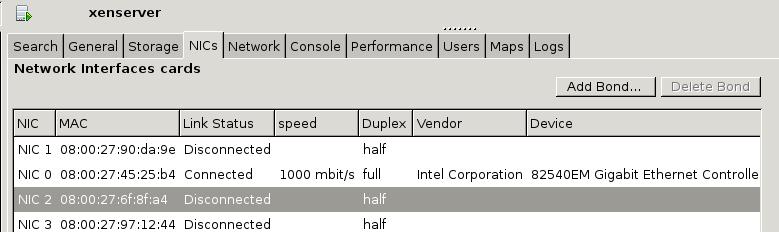
TechnologySince OpenXenManager could not scan the NICs, we need to scan the newly added NICs
under terminal.
# xe pif-list
# xe host-list
# xe pif-scan host-uuid=a7991728-a86f-4a9c-a163-9b819e444488
Via xe host-list we could get the host-uuid, then pif-scan it via this host-uuid.
Now you could see the newly added NICs in openxenmanager:
Dec 22, 2015
TechnologyCould not start cloudmonkey
After installing cloudstack, cloudmonkey couldnot be used, the reason is
listed as following:
% cloudmonkey
Traceback (most recent call last):
  File "/usr/local/bin/cloudmonkey", line 5, in <module>
    from pkg_resources import load_entry_point
  File "/System/Library/Frameworks/Python.framework/Versions/2.7/Extras/lib/python/pkg_resources.py", line 2603, in <module>
    working_set.require(__requires__)
  File "/System/Library/Frameworks/Python.framework/Versions/2.7/Extras/lib/python/pkg_resources.py", line 666, in require
    needed = self.resolve(parse_requirements(requirements))
  File "/System/Library/Frameworks/Python.framework/Versions/2.7/Extras/lib/python/pkg_resources.py", line 565, in resolve
    raise DistributionNotFound(req)  # XXX put more info here
pkg_resources.DistributionNotFound: requests
The solution is via:
# easy_install --upgrade pip
# pip install --upgrade setuptools
# pip install --upgrade distribute
# wget https://bitbucket.org/pypa/setuptools/raw/bootstrap/ez_setup.py -O - | python
So Now you could use cloudstack.
Use Ansible Together With Cloudmonkey
I think because my cloudstack agent didn’t use a bridge, so the cloudmonkey runs failed.
Cloudmonkey tips
Configure the secstorage download address for local usage.
# cloudmonkey update configuration name=secstorage.allowed.internal.sites
 value=192.168.0.0/16
Create a new service offering:
# cloudmonkey create serviceoffering cpunumber=1 cpuspeed=500 displaytext=monkeyking
memory=256 name=monkeyking
Register the new template:
cloudmonkey register template hypervisor=kvm zoneid=2ee04a60-499c-bcc6-c3ba92624b35 format=qcow2 name=tinycore displaytext=tinycoretemplate ispublic=true ostypeid=11 url=http://192.168.0.79/tiny.qcow2
The ostypeid could be adjusted in the graphical interface, while the ostypeid for
other Linux(64-bit) is
ostypeid = ff2564a4-a91e-11e5-9855-52540048638c
Start an instance via cloudmonkey, refers to following command:
$ Deploy VirtualMachine ZoneID=<zoneid> ServiceOfferingID=<serviceofferingid> TemplateID=<templateid> StartVM=false IPAddress=192.168.30.10 Name=My-VirtualMachine DisplayName=“My Virtual Machine”
Dec 17, 2015
Technology初始化配置
启动虚拟机以后,通过nsroot/nsroot登录入VPX.
清除所有配置:
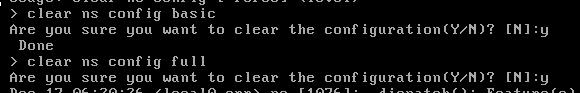
如下,做IP配置:
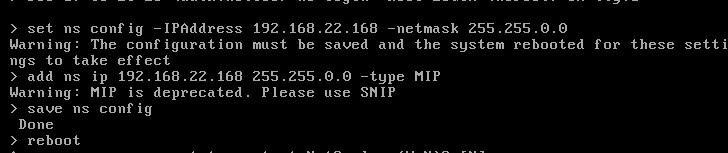
初始化配置完毕以后,即可在web后台进行配置。
License
申请license的时候注意,选择的MAC地址不能有任何的:符号, 例如52:54:00:这种就不能通过成
功。 在Netscaler上可以通过以下命令查看host id:
root@ns# lmutil lmhostid
lmutil - Copyright (c) 1989-2013 Flexera Software LLC. All Rights Reserved.
The FlexNet host ID of this machine is "xxxxxxx"
查看激活后的license情形:
> sh license
        License status:
                           Web Logging: YES
                      Surge Protection: YES
                        Load Balancing: YES
                     Content Switching: YES
....
参考:
http://sam.yeung.blog.163.com/blog/static/222663482013811102013782/
Dec 16, 2015
TechnologyTessera
直接导入Graphite中定义好的dashboard即可,值得注意的是,如何创建模板,或者说,如何创建一
个template用于渲染我们导入的各个数据?
导入的时候出现了如下的问题:
可见tessera中对数据的定制化是必须的。
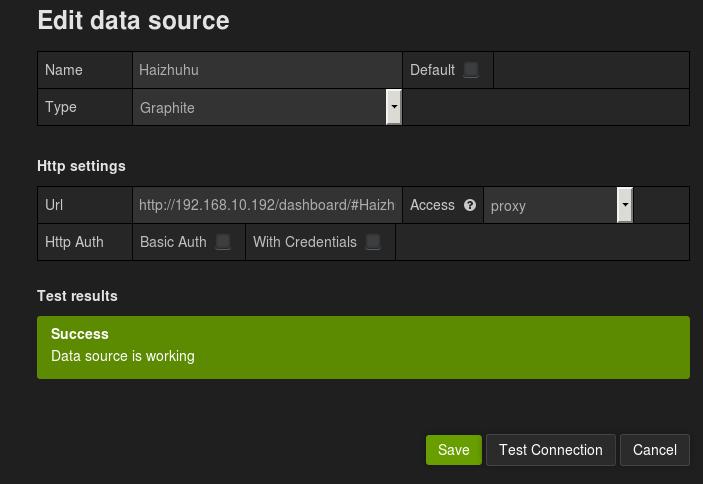
Grafana
安装及配置为自动启动:
$ wget https://grafanarel.s3.amazonaws.com/builds/grafana_2.6.0_amd64.deb
$ sudo dpkg -i grafana_2.6.0_amd64.deb
$ sudo service grafana-server start
$ sudo update-rc.d grafana-server defaults 95 10
默认用户名/密码为 admin/admin.
现在添加graphite数据源,例如:
Dec 16, 2015
Technology当前节点无数据
我们的脚本加入crontab运行后,最开始是可以得到数据的,后面两小时它挂了,查原因,有以下的
报错信息:
# /home/adminubuntu/GuangzhouPM25.py
Traceback (most recent call last):
  File "/home/adminubuntu/GuangzhouPM25.py", line 112, in <module>
    airdata = get_air_data(positionsets)
  File "/home/adminubuntu/GuangzhouPM25.py", line 80, in get_air_data
    PM25 = int(pattern.match(soup.find('td',{'id': 'pmtow'}).contents[0]).group())
ValueError: invalid literal for int() with base 10: ''
此时selenium控制的浏览器停在以下图例:
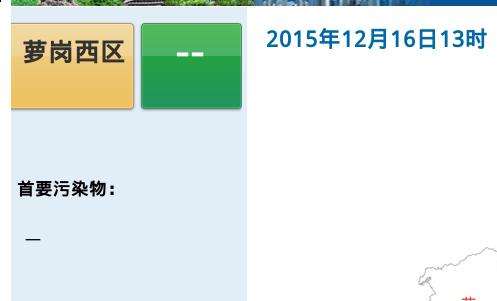
可以看到,如果当前节点的数据为--, 则我们的python脚本运行会出现问题。因而我们在代码中
要加入少量修改。
错误处理
以下的代码更改添加了错误处理,如果该监测点的数值为空,则不提交任何数据:
@@ -66,9 +66,9 @@ def get_air_data(positionsets):
   hourdata = {}
   # Calling selenium, need linux X
   browser = Firefox()
-  # Added 10 seconds for waiting page for loading.
-  time.delay(10)
   browser.get(URL)
+  # Added 10 seconds for waiting page for loading.
+  time.sleep(10)
   # Click button one-by-one
   for position in positionsets:
     # After clicking, should re-get the page_source.
@@ -78,33 +78,37 @@ def get_air_data(positionsets):
     soup = BeautifulSoup(page_source, 'html.parser')
     # pm2.5 value would be something like xx 微克/立方米, so we need an regex for
     # matching, example: print int(pattern.match(input).group())
-    PM25 = int(pattern.match(soup.find('td',{'id': 'pmtow'}).contents[0]).group())
-    PM25_iaqi = int(pattern.match(soup.find('td',{'id': 'pmtow_iaqi'}).contents[0]).group())
-    PM10 = int(pattern.match(soup.find('td',{'id': 'pmten'}).contents[0]).group())
-    PM10_iaqi = int(pattern.match(soup.find('td',{'id': 'pmten_iaqi'}).contents[0]).group())
-    SO2 = int(pattern.match(soup.find('td',{'id': 'sotwo'}).contents[0]).group())
-    SO2_iaqi = int(pattern.match(soup.find('td',{'id': 'sotwo_iaqi'}).contents[0]).group())
-    NO2 = int(pattern.match(soup.find('td',{'id': 'notwo'}).contents[0]).group())
-    NO2_iaqi = int(pattern.match(soup.find('td',{'id': 'notwo_iaqi'}).contents[0]).group())
-    # Special notice the CO would be float value
-    CO = float(floatpattern.match(soup.find('td',{'id': 'co'}).contents[0]).group())
-    CO_iaqi = int(pattern.match(soup.find('td',{'id': 'co_iaqi'}).contents[0]).group())
-    O3 = int(pattern.match(soup.find('td',{'id': 'othree'}).contents[0]).group())
-    O3_iaqi = int(pattern.match(soup.find('td',{'id': 'othree_iaqi'}).contents[0]).group())
-    hourdata_key = pinyin.get(position)
-    hourdata[hourdata_key] = []
-    hourdata[hourdata_key].append(PM25)
-    hourdata[hourdata_key].append(PM25_iaqi)
-    hourdata[hourdata_key].append(PM10)
-    hourdata[hourdata_key].append(PM10_iaqi)
-    hourdata[hourdata_key].append(SO2)
-    hourdata[hourdata_key].append(SO2_iaqi)
-    hourdata[hourdata_key].append(NO2)
-    hourdata[hourdata_key].append(NO2_iaqi)
-    hourdata[hourdata_key].append(CO)
-    hourdata[hourdata_key].append(CO_iaqi)
-    hourdata[hourdata_key].append(O3)
-    hourdata[hourdata_key].append(O3_iaqi)
+    try:
+      PM25 = int(pattern.match(soup.find('td',{'id': 'pmtow'}).contents[0]).group())
+      PM25_iaqi = int(pattern.match(soup.find('td',{'id': 'pmtow_iaqi'}).contents[0]).group())
+      PM10 = int(pattern.match(soup.find('td',{'id': 'pmten'}).contents[0]).group())
+      PM10_iaqi = int(pattern.match(soup.find('td',{'id': 'pmten_iaqi'}).contents[0]).group())
+      SO2 = int(pattern.match(soup.find('td',{'id': 'sotwo'}).contents[0]).group())
+      SO2_iaqi = int(pattern.match(soup.find('td',{'id': 'sotwo_iaqi'}).contents[0]).group())
+      NO2 = int(pattern.match(soup.find('td',{'id': 'notwo'}).contents[0]).group())
+      NO2_iaqi = int(pattern.match(soup.find('td',{'id': 'notwo_iaqi'}).contents[0]).group())
+      # Special notice the CO would be float value
+      CO = float(floatpattern.match(soup.find('td',{'id': 'co'}).contents[0]).group())
+      CO_iaqi = int(pattern.match(soup.find('td',{'id': 'co_iaqi'}).contents[0]).group())
+      O3 = int(pattern.match(soup.find('td',{'id': 'othree'}).contents[0]).group())
+      O3_iaqi = int(pattern.match(soup.find('td',{'id': 'othree_iaqi'}).contents[0]).group())
+      hourdata_key = pinyin.get(position)
+      hourdata[hourdata_key] = []
+      hourdata[hourdata_key].append(PM25)
+      hourdata[hourdata_key].append(PM25_iaqi)
+      hourdata[hourdata_key].append(PM10)
+      hourdata[hourdata_key].append(PM10_iaqi)
+      hourdata[hourdata_key].append(SO2)
+      hourdata[hourdata_key].append(SO2_iaqi)
+      hourdata[hourdata_key].append(NO2)
+      hourdata[hourdata_key].append(NO2_iaqi)
+      hourdata[hourdata_key].append(CO)
+      hourdata[hourdata_key].append(CO_iaqi)
+      hourdata[hourdata_key].append(O3)
+      hourdata[hourdata_key].append(O3_iaqi)
+    except ValueError, Argument:
+      # won't add the data, simply ignore this position
+      print "The argument does not contain numbers\n", Argument
   # After clicking all of the button, quit the firefox and return the dictionary
   browser.close()
   return hourdata
到现在为止,数据可以顺利的写入到Graphite中。
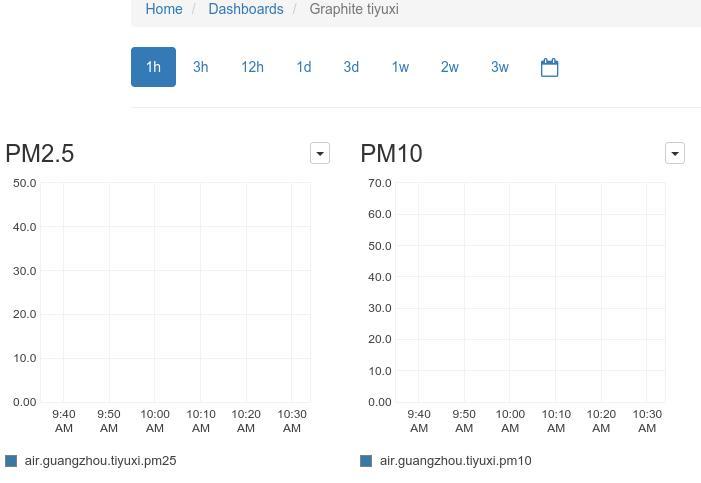
Graphite Dashboard
组建Graphite Dashboard可以通过图形界面来进行,举例如下:
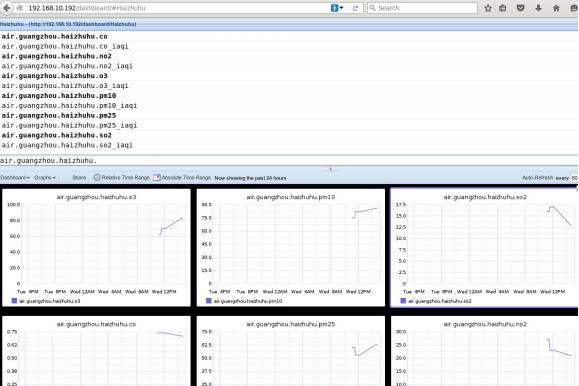
具体的添加过程就不说了,值得注意的是,设置几个属性,时间范围为过去24小时,
双击某图片后,Render Options里的Line Mode选择Connected Line,
这样可以构建出连接线,比较适合我们所需要展示的数据类型。Y-Axis,即Y轴的起点(Minimal)设置为0.
点击DashBoard-> Edit Dashboard, 可以看到以下定义:
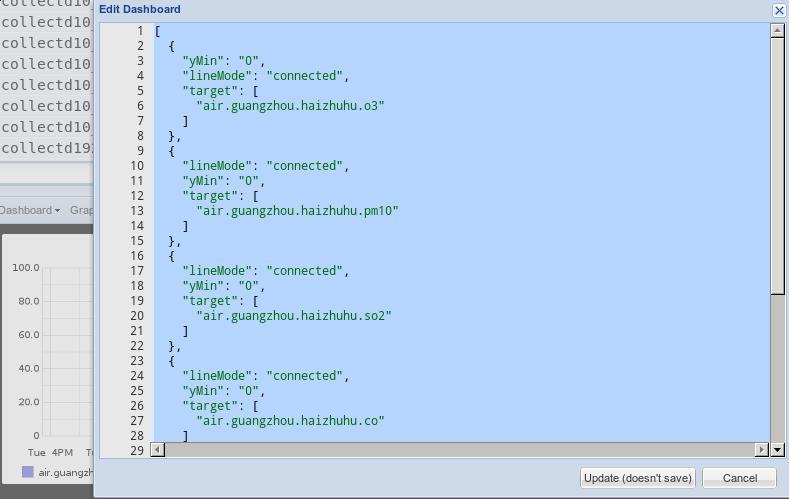
这个定义文件可以修改,我们将使用这个定义文件来批量制作其他十多个监测点的Dashboard.
创建更多的Dashboard
参考:
http://graphite.readthedocs.org/en/latest/dashboard.html#editing-importing-and-exporting-via-json
将上述的dashboard定义文件存储在某个文本文件中,
用下列命令批量生成新的dashboard定义文件:
$ cat dashboard.txt | sed 's/haizhuhu/aotizhongxin/g'|myclip
$ cat dashboard.txt | sed 's/haizhuhu/aotizhongxin/g'|myclip
$ cat dashboard.txt | sed 's/haizhuhu/baiyunshan/g'|myclip
$ cat dashboard.txt | sed 's/haizhuhu/dafushan/g'|myclip
$ cat dashboard.txt | sed 's/haizhuhu/gongyuanqian/g'|myclip
$ cat dashboard.txt | sed 's/haizhuhu/haizhubaogang/g'|myclip
$ cat dashboard.txt | sed 's/haizhuhu/haizhuchisha/g'|myclip
$ cat dashboard.txt | sed 's/haizhuhu/haizhuhu/g'|myclip
$ cat dashboard.txt | sed 's/haizhuhu/haizhushayuan/g'|myclip
$ cat dashboard.txt | sed 's/haizhuhu/huangpudashadi/g'|myclip
$ cat dashboard.txt | sed 's/haizhuhu/huangpuwenchong/g'|myclip
$ cat dashboard.txt | sed 's/haizhuhu/huangshalubianzhan/g'|myclip
$ cat dashboard.txt | sed 's/haizhuhu/liwanfangcun/g'|myclip
$ cat dashboard.txt | sed 's/haizhuhu/liwanxicun/g'|myclip
$ cat dashboard.txt | sed 's/haizhuhu/luhu/g'|myclip
$ cat dashboard.txt | sed 's/haizhuhu/luogangxiqu/g'|myclip
$ cat dashboard.txt | sed 's/haizhuhu/tianhelongdong/g'|myclip
$ cat dashboard.txt | sed 's/haizhuhu/tiyuxi/g'|myclip
$ cat dashboard.txt | sed 's/haizhuhu/yayuncheng/g'|myclip
$ cat dashboard.txt | sed 's/haizhuhu/yangjilubianzhan/g'|myclip
myclip是一个自定义的命令,可以将管道输出直接到系统剪贴板,
而后将内容新添加到dashboard定义文件中,点击update后,另存为新的dashboard即可.