Apr 6, 2016
TechnologySteps
Reconfigure the LC_ALL, etc:
$ sudo vim /etc/environment
LC_ALL=en_US.UTF-8
LANG=en_US.UTF-8
$ sudo locale-gen "en_US.UTF-8"
$ sudo dpkg-reconfigure locales
$ sudo reboot
Be Sure to use latest repository, like aliyun.com.
$ sudo apt-get update -y
$ sudo bash
# apt-key adv --keyserver hkp://p80.pool.sks-keyservers.net:80 --recv-keys 58118E89F3A912897C070ADBF76221572C52609D
#
Trouble-Shooting
Docker download too slow, download it to local.
Apr 5, 2016
TechnologyIn Vagrantfile, edit the following definition:
  config.vm.provider "virtualbox" do |vb|
  #   # Display the VirtualBox GUI when booting the machine
  #   vb.gui = true
  #
  #   # Customize the amount of memory on the VM:
    vb.memory = "1024"
    file_to_disk = File.realpath( "." ).to_s + "/disk.vdi"
    if ARGV[0] == "up" && ! File.exist?(file_to_disk)
      puts "Creating 5GB disk #{file_to_disk}."
      vb.customize [
        'createhd',
        '--filename', file_to_disk,
        '--format', 'VDI',
        '--size', 5000 * 1024 # 5 GB
        ]
      vb.customize [
        'storageattach', :id,
        '--storagectl', 'SATA',
        '--port', 1, '--device', 0,
        '--type', 'hdd', '--medium',
        file_to_disk
        ]
    end
    #config.vm.provision "shell", path: "scripts/add_new_disk.sh"
  end
  config.vm.provision "shell", path: "scripts/add_new_disk.sh"
The add_new_disk.sh should be written like following:
set -e
set -x

if [ -f /etc/disk_added_date ]
then
   echo "disk already added so exiting."
   exit 0
fi


sudo fdisk -u /dev/sdb <<EOF
n
p
1


t
8e
w
EOF

pvcreate /dev/sdb1
vgextend VolGroup /dev/sdb1
lvextend -l +100%FREE /dev/VolGroup/lv_root
resize2fs /dev/VolGroup/lv_root

date > /etc/disk_added_date
Notice: this won’t fit for Ubuntu Snappy Core.
Apr 1, 2016
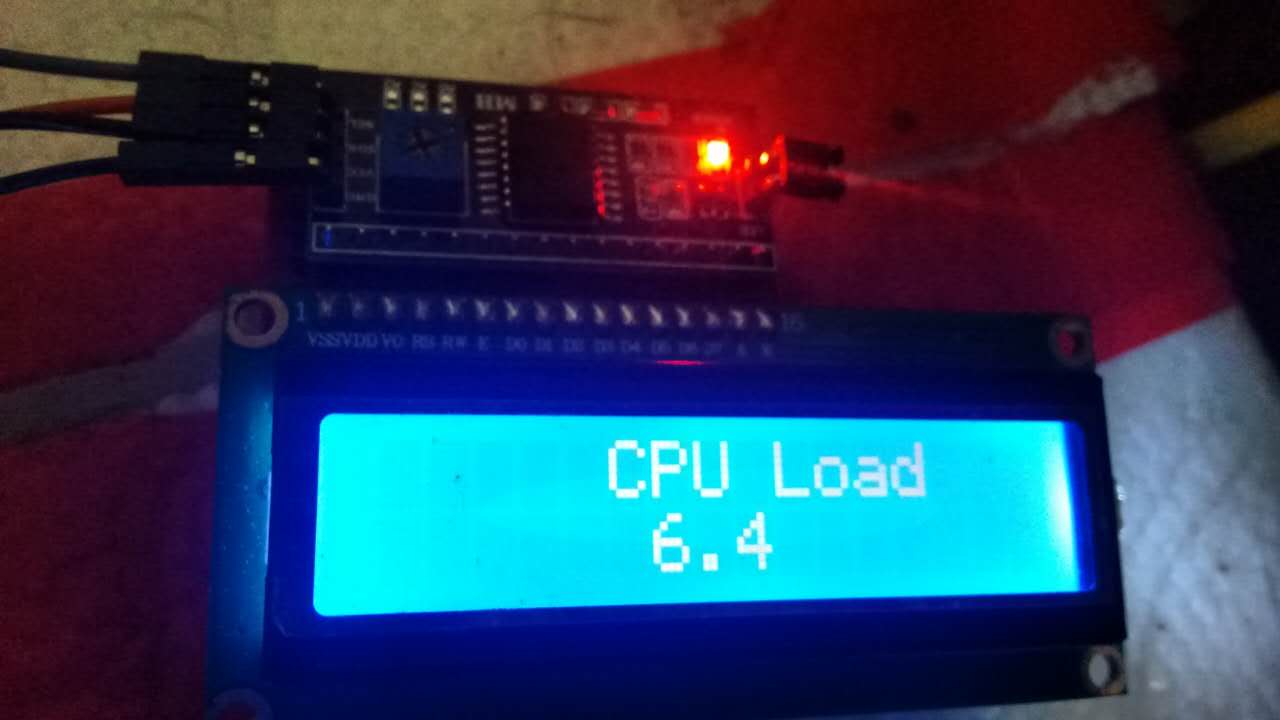
Technology今天更新了一下代码,实现了两行显示,第一行显示CPU Load,第二行显示剩余内存数。
只是部分替代数据显示部分,这个代码还是有BUG的,譬如说最后一位在下一次显示时不会被清零。
import psutil
import serial
import time


# Setup the Serial Port and open it.
ser = serial.Serial()
ser.baudrate = 9600
ser.port = '/dev/ttyUSB0'
ser.open()
## Todo, to check if the port is opened.

# Really talks to the i2c LCD.

# Setup the wiring
ser.write(b'i2c.setup(0, 4, 3, i2c.SLOW)\r\n')

# dofile, load the lcd library
ser.write(b'lcd = dofile("lcd1602.lua")()\r\n')

# Now Refresh the LCD.
ser.write(b'lcd.clear()\r\n')
#ser.write(b'lcd.put(lcd.light(on))\r\n')
ser.write(b'lcd.put(lcd.locate(0, 0), "CPU Load: ")\r\n')
ser.write(b'lcd.put(lcd.locate(1, 0), "Mem Free: ")\r\n')
ser.write(b'lcd.put(lcd.locate(0, 14), "%")\r\n')
ser.write(b'lcd.put(lcd.locate(1, 14), "MB")\r\n')

# Fetching the percentage per 1 second
# Todo, change the while true into CTRL+C stopped.
while True:
    # Get current percentage
    #ser.write(b'lcd.clear()\r\n')
    currentPer = str(psutil.cpu_percent()).encode('ascii')
    memFree = str(int(psutil.virtual_memory().free/1024/1024)).encode('ascii')
    oneLine = b'lcd.put(lcd.locate(0, 9), "' + currentPer + b'")\r\n'
    SecondLine = b'lcd.put(lcd.locate(1, 9), "' + memFree + b'")\r\n'
    # Format oneLine
    #ser.write(b'lcd.put(lcd.locate(0, 0), "CPU Load: ")\r\n')
    #ser.write(b'lcd.put(lcd.locate(1, 0), "Mem Free: ")\r\n')
    #ser.write(b'lcd.put(lcd.locate(0, 14), "%")\r\n')
    #ser.write(b'lcd.put(lcd.locate(1, 14), "MB")\r\n')
    #time.sleep(0.2)
    ser.write(oneLine)
    time.sleep(0.2)
    ser.write(SecondLine)
    time.sleep(1)
Mar 31, 2016
Technology最初入手的1602是N个口的, 激活它需要耗掉开发板上N个GPIO口,为此做完Arduino上的实
验就收了起来. 这次采购中看到店家有卖1602 I2C的转接卡,3块钱,顺手就买了回来.打算
用来做一个WIFI显示屏.
今天做了一个NodeMCU和1602连接实时显示CPU使用率的方案, 如下图所示,这里简单记录
一下制作过程.
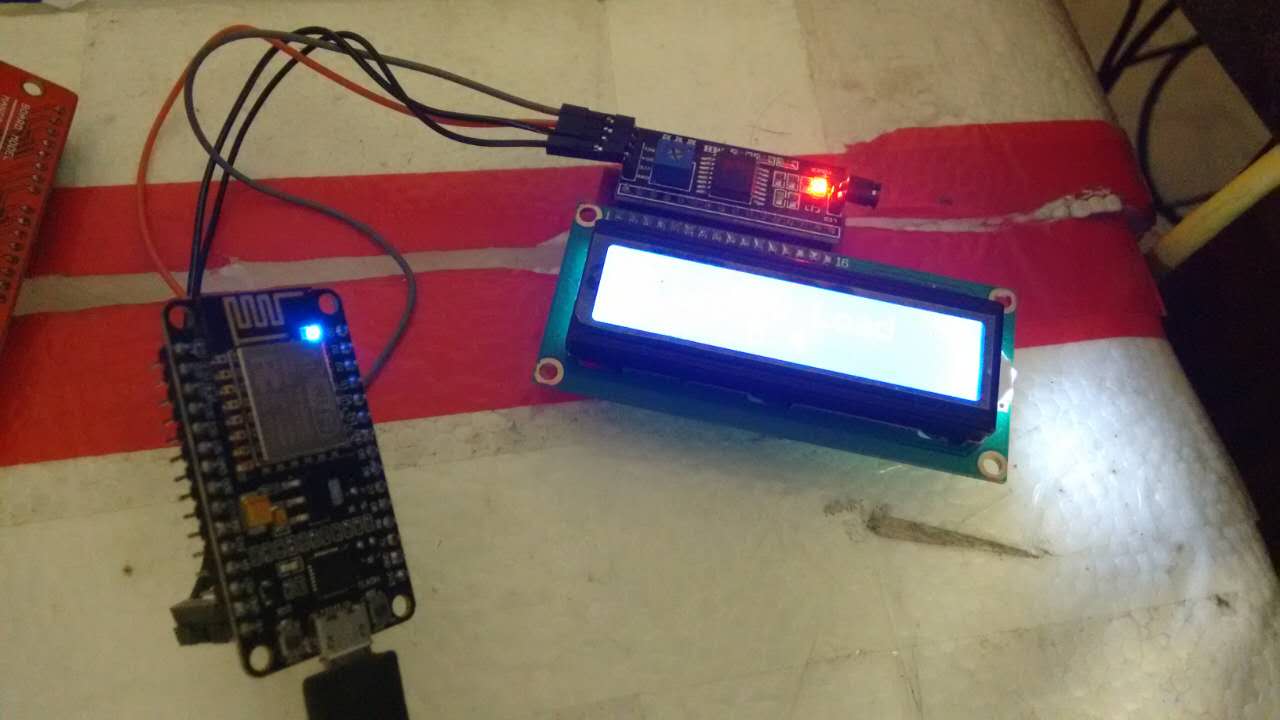
连线图
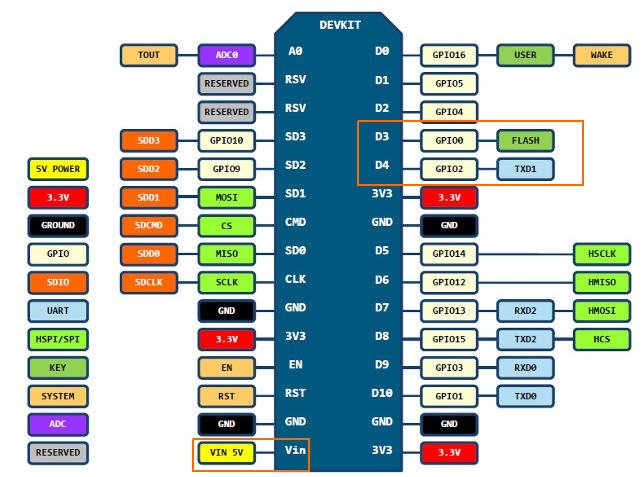
1602 I2C上有四个口,分别是GND/VCC/SDA/SCL.
GND自然不用多说,连接NodeMCU上的GND即可.
VCC我们使用5V输入,在NodeMCU上则是VIN口. 在下图里我用红色做了标注.
SDA接GPIO0, SDC接GPIO2,在图中我用橙色做了标识.
软件准备
我这里参考了
http://domoticx.com/esp8266-wifi-lcd-1602-2004-via-i2c-nodemcu/
上的实例, 所以用ESPlorer来写入1602的库文件. ESPlorer的下载地址在:
http://esp8266.ru/esplorer/#download
如果你使用的是ArchLinux的话,一行命令就够了:
$ yaourt esplorer
如果你运行上述网址上的示例, 故事的结尾你会获得一个Hallo的显示,以及跑马灯式的显
示效果.
CPU Load Program
先上代码, 用Python写的, 如果你看过上面的示例程序就会明白, 往串口写入1602的lua
脚本,就能获得对应的显示效果,那么以下的Python代码就是每分钟读取CPU的负载值, 将
它封装在一个字符串中发送到NodeMCU连接的串口.
import psutil
import serial
import time


# Setup the Serial Port and open it.
ser = serial.Serial()
ser.baudrate = 9600
ser.port = '/dev/ttyUSB0'
ser.open()
## Todo, to check if the port is opened.

# Really talks to the i2c LCD.

# Setup the wiring
ser.write(b'i2c.setup(0, 4, 3, i2c.SLOW)\r\n')

# dofile, load the lcd library
ser.write(b'lcd = dofile("lcd1602.lua")()\r\n')

# Now Refresh the LCD.
ser.write(b'lcd.clear()\r\n')

# Fetching the percentage per 1 second
# Todo, change the while true into CTRL+C stopped.
while True:
    # Get current percentage
    ser.write(b'lcd.clear()\r\n')
    currentPer = str(psutil.cpu_percent()).encode('ascii')
    # Format oneLine
    ser.write(b'lcd.put(lcd.locate(0, 5), "CPU Load")\r\n')
    oneLine = b'lcd.put(lcd.locate(1, 6), "' + currentPer + b'")\r\n'
    # Write oneLine
    ser.write(oneLine)
    time.sleep(1)
代码运行的前提条件是,在ArchLinux上,安装pyserial库和psutil库,
而后运行sudo python WriteLoadToLCD.py.
$ sudo pacman -S python-psutil
$ sudo pacman -S python-pyserial
可以看到你的系统CPU使用率已经显示在1602 LCD上了,每分钟更新一次.
当然你也可以将显示
值从CPU使用率换成内存占用率,或是CPU温度,或是PM2.5的值等等. 你要做的就是构建自
己的数据CurrentPer和写入的格式oneLine.
通过串口发送数据, 通过NodeMCU驱动1602, 这功能对NodeMCU而言太小儿科了,所以接下
来我会继续做一个WIFI驱动的LCD.
Mar 29, 2016
TechnologyPrerequisition
Refers
tohttps://github.com/crashdump/collectd-xenserver
- Collected 4.9 or later
- Python2.4 Or Later
- sudo pip install XenAPI
- sudo pip install collectd
Configuration
Make a directory under /etc/collectd folder, and copy the
collectd-xenserver.py into this folder:
$ sudo mkdir -p  /var/collectd/plugins
$ sudo cp YourDictory/collectd-xenserver.py /var/collectd/plugins/collectd_xenserver.py
Now edit the configuration file of /etc/collectd/collectd.conf:
<LoadPlugin python>
	Globals true
</LoadPlugin>

<Plugin python>
	ModulePath "/etc/collectd/plugins/"
	#LogTraces true
	#Interactive true
	Import "collectd_xenserver"
        <Module "collectd_xenserver">
              <Host "192.168.10.187">
                    User "root"
                    Password "xxxxx"
              </Host>
        </Module>

</Plugin>
Now restart the collectd, you will find the data-set has been collectd and
send into the graphite server.
$ sudo service collectd restart