Add optional data into snmpd
Oct 23, 2013
Technology
###Prepare the script We get the current system load from /proc/loadavg:
	[Trusty@XXXyyy ~]$ cat /bin/online.sh
	#!/bin/sh
	echo .1.3.6.1.4.1.102.8
	cat /proc/loadavg | awk {'print $1'}
Then we have to add this script to our /etc/snmp/snmpd.conf:
extend .1.3.6.1.4.1.2021.53 online_monitor /bin/sh /bin/online.sh
Restart the service:
systemctl restart snmpd
Use snmpwalk to view the newly added item:
snmpwalk -v 2c -c public 10.0.0.221 .1.3.6.1.4.1.2021.53
###Fetch the data See the following data is what we want:
	root@ubuntu:/etc# snmpwalk -v 2c -c public 10.0.0.221 .1.3.6.1.4.1.2021.53.4.1.2.14.111.110.108.105.110.101.95.109.111.110.105.116.111.114.2
	iso.3.6.1.4.1.2021.53.4.1.2.14.111.110.108.105.110.101.95.109.111.110.105.116.111.114.2 = STRING: "0.77"
###Draw images in cacti
First, add a data templates:
Console->Data Templates->Add,
Data Template Name: MonitorArchCustomized
Data Source Name: |host_description|-MonitorArchCustomized
Data Input Method: Get SNMP Data
Associated RRA’s: Hourly(1 Minutes Average)
Internal Data Source Name: MonitorArchCustom
Then click “Create”
some additional field will be displayed, in the newly field “Custom Data [data input: Get SNMP Data]” insert the OID field with “.1.3.6.1.4.1.2021.53.4.1.2.14.111.110.108.105.110.101.95.109.111.110.105.116.111.114.1”(which you got from the snmpwalk output result)
Second, add a graph templates:
Templat Name: MonitorArchCustomized
Graph template Title: |host_description|-MonitorArchCustomized
Create and then insert the Graph Template Items, add like following:
	Graph Item 	Data Source 	Graph Item Type 	CF Type 	Item Color
	Item # 1 	(MonitorArchCustom): 	AREA 	AVERAGE 	  	FF00FF 	Move Down Move Up 	Delete
	Item # 2 	(MonitorArchCustom): 	GPRINT 	LAST 	  	F5F800 	Move Down Move Up 	Delete
	Item # 3 	(MonitorArchCustom): Average 	GPRINT 	AVERAGE 	  	8D85F3 	Move Down Move Up 	Delete
	Item # 4 	(MonitorArchCustom): MAX 	GPRINT 	MAX 	  	005D57 	Move Down Move Up 	Delete
Also notice the Data Source should be MonitorArchCustom.
Third, add a new graph under Host of ArchLinux.
Select the Graph template and then click Create.
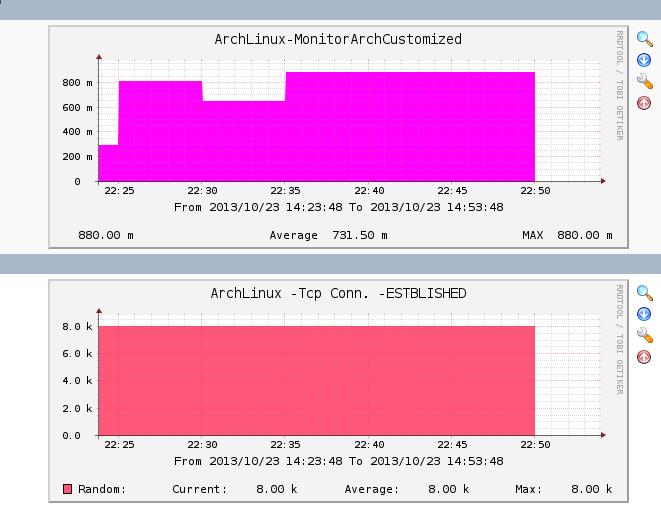
After some minutes, you will see the newly captured data and the images under graphs-> Arch-> Host:ArchLinux. Maybe Your graphs trees are not the same as mine, you got found your own location.

