PrometheusTips
Jul 23, 2018
Technology
AIM
Setup prometheus monitoring system in inner intranet.
OS: CentOS/Ubuntu/RHEL, etc.
Prometheus Server
Run server in following commands:
# vim /xxxxxx/prometheus/prometheus.yml
    global:
      scrape_interval:     15s # Set the scrape interval to every 15 seconds. Default is every 1 minute.
      evaluation_interval: 15s # Evaluate rules every 15 seconds. The default is every 1 minute.
      # scrape_timeout is set to the global default (10s).

      # Attach these labels to any time series or alerts when communicating with
      # external systems (federation, remote storage, Alertmanager).
      external_labels:
        monitor: 'kkkkk-monitor'

    # Alertmanager configuration
    alerting:
      alertmanagers:
      - static_configs:
        - targets:
          # - alertmanager:9093

    # Load rules once and periodically evaluate them according to the global 'evaluation_interval'.
    rule_files:
      # - "first_rules.yml"
      # - "second_rules.yml"

    # A scrape configuration containing exactly one endpoint to scrape:
    # Here it's Prometheus itself.
    scrape_configs:
      # The job name is added as a label `job=<job_name>` to any timeseries scraped from this config.
      - job_name: 'prometheus'

        # metrics_path defaults to '/metrics'
        # scheme defaults to 'http'.

        static_configs:
            - targets: ['localhost:9090', '192.192.189.1:9100']

# docker run -d -p 9090:9090 -v /xxxxxx/prometheus/prometheus.yml:/etc/prometheus/prometheus.yml -v /media/sda5/prometheus:/prometheus prom/prometheus
node-export
In every node, run following:
# docker run -d --net="host" --pid="host" quay.io/prometheus/node-exporter
grafana
Run grafana server via:
# docker run -d -p 3000:3000 -e "GF_SECURITY_ADMIN_PASSWORD=admin_password" -v /media/sda5/grafana_db:/var/lib/grafana grafana/grafana
Add grafana id of 1860(Node Exporter Full) or 159(Prometheus system), then you could view the grafana displayed dashboard of node-exporter of the system.
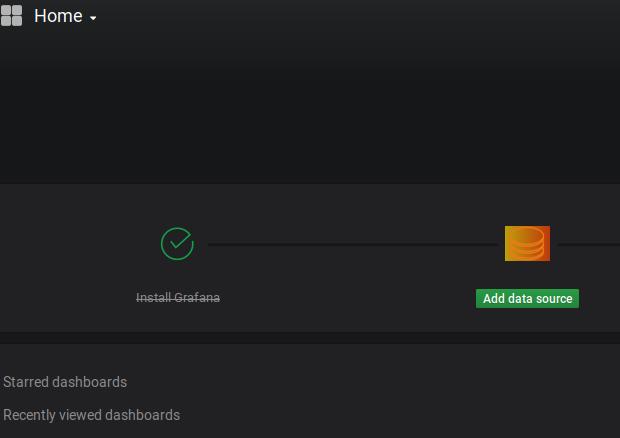
grafana configuration
Initial picture:
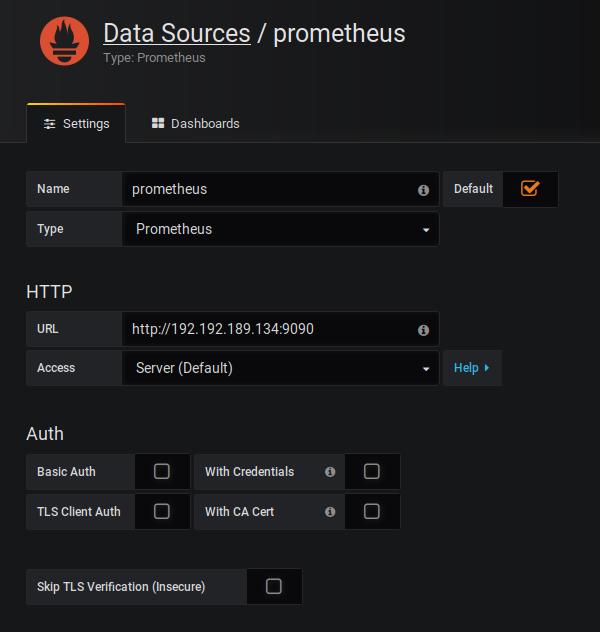
Add datasource:
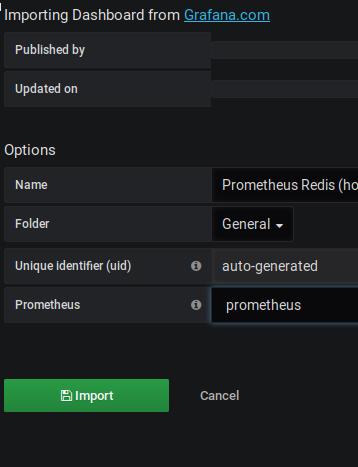
Add redis templates:
# wget https://raw.githubusercontent.com/oliver006/redis_exporter/master/contrib/grafana_prometheus_redis_dashboard_alias.json
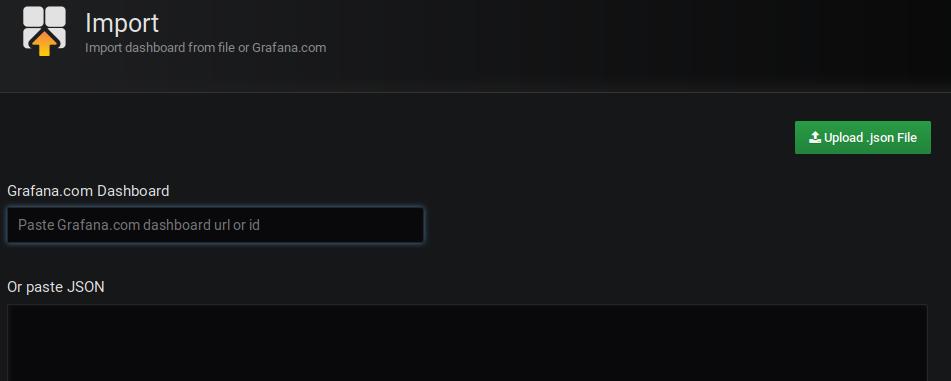
Import:
Detailed:
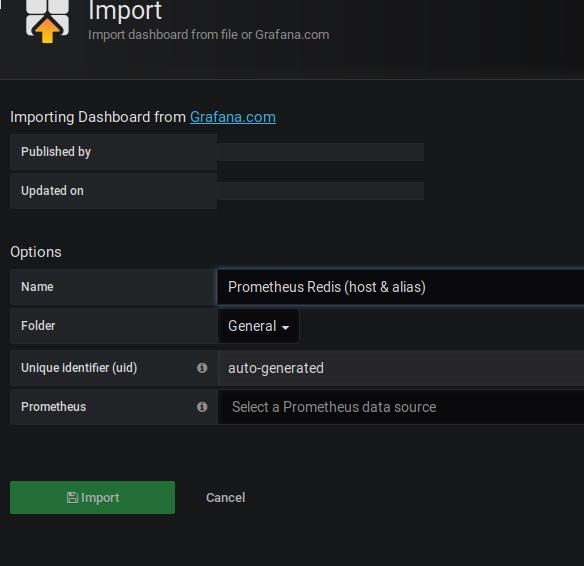
Corresponding data source: