RateLimitingOnInstio
May 1, 2018
Technology
Service Example
The yaml file is directly taken from the official example of helloworld, but
I remove the v2 deployment, thus the yaml file is listed as following:
apiVersion: v1
kind: Service
metadata:
  name: helloworld
  labels:
    app: helloworld
spec:
  type: NodePort
  ports:
  - port: 5000
    name: http
  selector:
    app: helloworld
---
apiVersion: extensions/v1beta1
kind: Deployment
metadata:
  name: helloworld-v1
spec:
  replicas: 1
  template:
    metadata:
      labels:
        app: helloworld
        version: v1
    spec:
      containers:
      - name: helloworld
        image: istio/examples-helloworld-v1
        resources:
          requests:
            cpu: "100m"
        imagePullPolicy: IfNotPresent #Always
        ports:
        - containerPort: 5000
Use istioctl for injecting the sidecar, thus we could later use prometheus for monitoring its traffic flow:
# kubectl create -f <(istioctl kube-inject -f helloworld.yaml)
Examine the deployment/service/pods:
# kubectl get svc helloworld
NAME         TYPE       CLUSTER-IP    EXTERNAL-IP   PORT(S)          AGE
helloworld   NodePort   10.96.242.5   <none>        5000:31241/TCP   27m
# kubectl get deployment helloworld-v1
NAME            DESIRED   CURRENT   UP-TO-DATE   AVAILABLE   AGE
helloworld-v1   1         1         1            1           27m
# kubectl get pods | grep helloworld
helloworld-v1-7d57446779-dctlv    2/2       Running   0          27m
Make ingress
The helloworld-ingress.yaml is listed as following:
apiVersion: extensions/v1beta1
kind: Ingress
metadata:
  name: helloworld
  annotations:
    kubernetes.io/ingress.class: "istio"
spec:
  rules:
  - http:
      paths:
      - path: /hello
        backend:
          serviceName: helloworld
          servicePort: 5000
Create the ingress and verify it:
# kubectl create -f helloworld-ingress.yaml
# kubectl get ingress helloworld
NAME         HOSTS     ADDRESS   PORTS     AGE
helloworld   *                   80        1h
# curl http://192.168.99.100:30039/hello
Hello version: v1, instance: helloworld-v1-7d57446779-dctlv
Rate Limiting
Write following rete limiting yaml for defining its traffic:
apiVersion: "config.istio.io/v1alpha2"
kind: memquota
metadata:
  name: helloworldservicehandler
  namespace: istio-system
spec:
  quotas:
  - name: helloworldservicerequestcount.quota.istio-system
    maxAmount: 5000
    validDuration: 1s
    # The first matching override is applied.
    # A requestcount instance is checked against override dimensions.
    overrides:
    # The following override applies to 'helloworld' regardless
    # of the source.
    - dimensions:
        destination: helloworld
      maxAmount: 2
      validDuration: 1s

---
apiVersion: "config.istio.io/v1alpha2"
kind: quota
metadata:
  name: helloworldservicerequestcount
  namespace: istio-system
spec:
  dimensions:
    source: source.labels["app"] | source.service | "unknown"
    sourceVersion: source.labels["version"] | "unknown"
    destination: destination.labels["app"] | destination.service | "unknown"
    destinationVersion: destination.labels["version"] | "unknown"

---
apiVersion: "config.istio.io/v1alpha2"
kind: rule
metadata:
  name: helloworldservicequota
  namespace: istio-system
spec:
  actions:
  - handler: helloworldservicehandler.memquota
    instances:
    - helloworldservicerequestcount.quota
---
apiVersion: config.istio.io/v1alpha2
kind: QuotaSpec
metadata:
  creationTimestamp: null
  name: helloworldservicerequest-count
  namespace: istio-system
spec:
  rules:
  - quotas:
    - charge: 1
      quota: RequestCount
---
apiVersion: config.istio.io/v1alpha2
kind: QuotaSpecBinding
metadata:
  creationTimestamp: null
  name: helloworldservicerequest-count
  namespace: istio-system
spec:
  quotaSpecs:
  - name: helloworldservicerequest-count
    namespace: istio-system
  services:
  - name: helloworld
    namespace: default
The above items define a 2 qps rate limiting.
Monitoring
Use prometheus for monitoring the traffic, enable prometheus via:
# kubectl create -f ~/Code/istio-0.7.1/install/kubernetes/addons/prometheus.yaml
You could configure the prometheus’s service type to NodePort, thus you could directly access it.
Make the traffic:
# while true; do curl -s -o /dev/null http://192.168.99.100:30039/hello;done
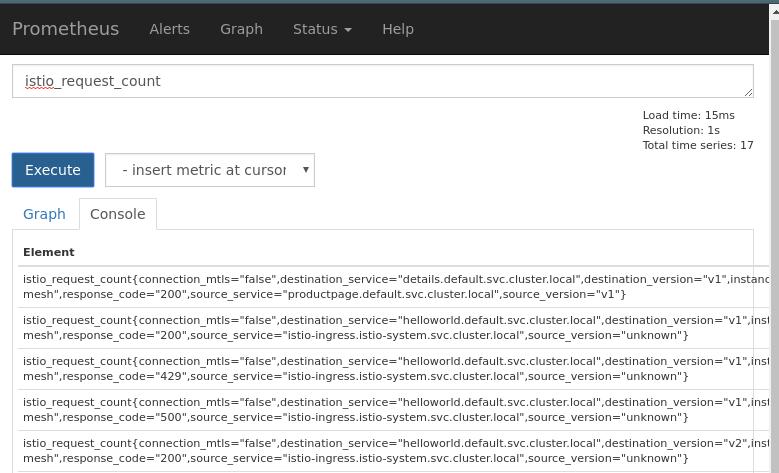
Then view the prometheus via following:
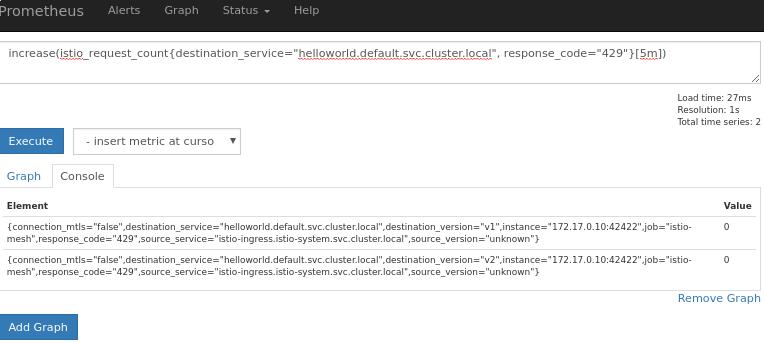
# increase(istio_request_count{destination_service="helloworld.default.svc.cluster.local", response_code="429"}[5m])
Initial:
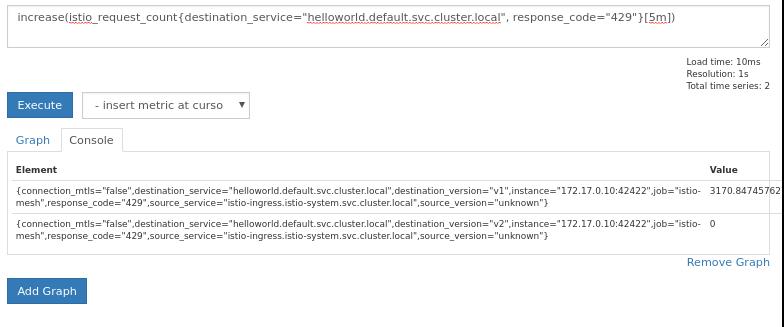
After aboult 3 minutes:
You could change the response code from 429 to 200, this means you get the
succeed rate.
Fetch back the result
Refers to:
https://www.robustperception.io/prometheus-query-results-as-csv/
# wget https://raw.githubusercontent.com/RobustPerception/python_examples/master/csv/query_csv.py
For querying the 429/200:
#  python query_csv.py http://127.0.0.1:9090 'increase(istio_request_count{destination_service="helloworld.default.svc.cluster.local", response_code="429"}[5m])'
name,timestamp,value,connection_mtls,destination_service,destination_version,instance,job,response_code,source_service,source_version
,1525185609.906,8145.762711864407,false,helloworld.default.svc.cluster.local,v1,172.17.0.10:42422,istio-mesh,429,istio-ingress.istio-system.svc.cluster.local,unknown
#  python query_csv.py http://127.0.0.1:9090 'increase(istio_request_count{destination_service="helloworld.default.svc.cluster.local", response_code="200"}[5m])'
name,timestamp,value,connection_mtls,destination_service,destination_version,instance,job,response_code,source_service,source_version
,1525185628.005,886.7796610169491,false,helloworld.default.svc.cluster.local,v1,172.17.0.10:42422,istio-mesh,200,istio-ingress.istio-system.svc.cluster.local,unknown
8145 and 886 are the values for the query, we could use them for 2nd
development.