用Graphite呈现广州空气质量
Dec 15, 2015
Technology
数据源准备
数据源地址在:
http://210.72.1.216:8080/gzaqi_new/RealTimeDate.html
但是这个地址取回数据比较困难。而在http://www.gzepb.gov.cn/ 右侧的栏里可以通过点击,打开某个监测点当前的空气质量指数,例如海珠湖的数据位于:
http://210.72.1.216:8080/gzaqi_new/DataList2.html?EPNAME=%E6%B5%B7%E7%8F%A0%E6%B9%96
Beautiful Soup
Beautiful Soup可以被理解为网页爬虫,用于爬取某个页面并取回所需信息。在Ubuntu/Debian系统 中,安装命令如下。同时为了使用对XML解析速度更快的lxml解析器,我们安装python-lxml:
$ sudo apt-get install -y python-bs4
$ sudo apt-get install -y python-lxml
现在我们打开某个终端,开始用命令行交互的方式,取回海珠湖监测点的数据:
首先,引入所需的库:
# python
Python 2.7.6 (default, Jun 22 2015, 17:58:13)
[GCC 4.8.2] on linux2
Type "help", "copyright", "credits" or "license" for more information.
>>> from bs4 import BeautifulSoup
>>> import urllib2
>>> response = urllib2.urlopen('http://210.72.1.216:8080/gzaqi_new/DataList2.html?EPNAME=%E6%B5%B7%E7%8F%A0%E6%B9%96')
>>> print response.info()
Content-Length: 10216
Content-Type: text/html
Last-Modified: Wed, 13 May 2015 08:12:28 GMT
Accept-Ranges: bytes
ETag: "b680828d548dd01:da2"
Server: Microsoft-IIS/6.0
X-Powered-By: ASP.NET
Date: Tue, 15 Dec 2015 02:25:17 GMT
Connection: close

>>> html = response.read()
>>> print "Get the length :", len(html)
Get the length : 10216
>>> response.close()  # best practice to close the file
上述的操作里调用urllib2取回了页面, html变量里包含了该网页的内容。接下来我们使用 BeautifulSoup来美化并从中取回我们想要的元素。
>>> soup = BeautifulSoup(html, 'html.parser')
>>> print soup.prettify()
仔细检查后发现,用urllib2取回的网页中,html变量里未包含当前的数据值。通过阅读代码得知, 当前页面的值是浏览器在载入网页时执行javascript函数得到的。因而我们使用一个真实的浏览器 来实现页面的抓取。
Selenium是一套用于进行浏览器自动化测试的开源工具集,可进行Web应用的端到端测试 。Selenium主要包括两个工具:一是Selenium IDE,二是Selenium WebDriver(简称 WebDriver). 安装命令如下:
$ pip install selenium
使用selenium抓取该网页的代码如下:
>>> from contextlib import closing
>>> from selenium.webdriver import Firefox
>>> from selenium.webdriver.support.ui import WebDriverWait
>>> url='http://210.72.1.216:8080/gzaqi_new/DataList2.html?EPNAME=%E6%B5%B7%E7%8F%A0%E6%B9%96'
>>> with closing(Firefox()) as browser:
...   browser.get(url)
...   page_source = browser.page_source
...
>>> print page_source
>>> soup = BeautifulSoup(page_source, 'html.parser')
>>> print soup
现在我们可以看到,取回的page_source变量中已经包含有该时段的数据。接下来就是如何把数据
从其中提取出来的过程。
定位到含有数据的表格, 根据其层叠结构,获得tr的值:
>>> table = soup.find('table', {'class': 'headTable'})
>>> for td in table.tbody.tr:
...     print td
...
<td class="SO2_24H">7</td>
<td class="NO2_24H">50</td>
<td class="PM10_24H">29</td>
<td class="CO_24H">31</td>
<td class="O3_8H_24H">18</td>
<td class="PM25_24H">25</td>
<td class="AQI">50</td>
<td class="Pollutants">—</td>
<td class="jibie2">--</td>
<td class="jibie2">一级</td>
<td class="leibie">优                  </td>
<td class="yanse"><img alt="" src="Images/you.jpg"/></td>
更进一步得到值:
>>> for td in table.tbody.tr:
...     print td.contents[0]
...
7
50
29
31
18
25
50
—
--
一级
优
<img alt="" src="Images/you.jpg"/>
对应的图片如下:

提取出来了数据,就可以做后续处理了。
Graphite
Graphite的搭建过程不提及。基于我们前面提取出的数据,只需要将其写入Graphite,就可以看 到数据的显示了。
具体的写入代码参考(需翻墙):
http://coreygoldberg.blogspot.com/2012/04/python-getting-data-into-graphite-code.html
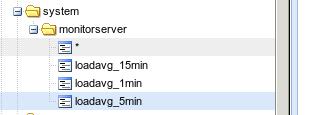
按照博客中提供的例子,写入到Graphite后的数据在Graphite看起来是这样的:

而对应的数据格式则如下:
 sending message:
     system.monitorserver.loadavg_1min 0.18 1450161396
     system.monitorserver.loadavg_5min 0.25 1450161396
     system.monitorserver.loadavg_15min 0.23 1450161396
我们可以仿照这样的数据来组织自己的空气质量数据。
数据来源再加工
前面取回地址失败, 因为它只是返回空气日报的地址,我们需要的是实时情况,所以还是回到
http://210.72.1.216:8080/gzaqi_new/RealTimeDate.html
这里需要在selenium里模拟出鼠标快速点击所有链接的效果。
下面是一次完整的点击白云山按钮并获得PM2.5页面的过程:
root@monitorserver:~/Code# python
Python 2.7.6 (default, Jun 22 2015, 17:58:13)
[GCC 4.8.2] on linux2
Type "help", "copyright", "credits" or "license" for more information.
>>> from contextlib import closing
>>> from selenium.webdriver import Firefox
>>> from selenium.webdriver.support.ui import WebDriverWait
>>> driver = Firefox()
>>> driver.get('http://210.72.1.216:8080/gzaqi_new/RealTimeDate.html')
>>> driver.refresh()
>>> baiyunmountain=driver.find_element_by_id("白云山")
>>> baiyunmountain.click()
>>> PM25=driver.find_element_by_id("PM25")
>>> type(PM25)
<class 'selenium.webdriver.remote.webelement.WebElement'>
>>> PM25.click()
