Cacti and snmpd
Oct 23, 2013
Technology
On the machine being monitored, check the snmpd configuration file, you will find some items like following:
	$ cat /etc/snmp/snmpd.conf
	rocommunity public
	rwcommunity admin
	agentaddress tcp:161
	If you want to enable Location and contact, add:
	syslocation Bat. C2
	syscontact someone@somewhere.org
On the monitor PC, we can use following command to view the monitored machine’s status:
	$ snmpwalk -c Trusty -v 2c 10.0.0.221:661
	or
	$ snmpwalk -c Trusty -v 2c 10.0.0.221
How to configure cacti
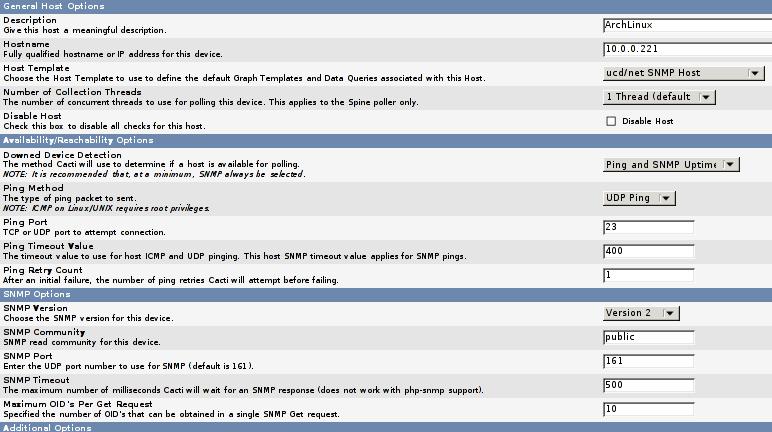
Add a new device for monitoring: Console-> Management->Devices, add new, the configuration should like following:

After save, you should view the result displayed like:
	ArchLinux (10.0.0.221)
	 SNMP Information
	System:Linux DashArch 3.11.6-1-ARCH #1 SMP PREEMPT Fri Oct 18 23:22:36 CEST
	 2013 x86_64
	Uptime: 1137 (0 days, 0 hours, 0 minutes)
	Hostname: DashArch
	Location: Unknown
	Contact: root@localhost
Draw disks
Add following line into snmpd.conf
includeAllDisks
But I failed, later will change.
###Add Graphs
Click “Create Graphs for this Host”, then you will asked to add the graphs.
After you add the graphs, add a new graph trees. Then add a Tree Items, Parent -> [root] Tree Item Type –> Host, Host –> ArchLinux(10.0.0.221), then save.
Now click on graphs, you can get your tree and view all of the images.
###Add Device for Winxp
Install the snmp service under control pannel.
enable the snmp service in Administration tools -> Service.
In cacti, add a new equipment, host templates choose “Windows 2000/XP host” , Downed Device Detection choose “SNMP uptime” , then add your own data source and graphics.
